Cayman: Butterfield reports Fourth Quarter and Full Year 2021 Results

Current Earnings Release
Financial highlights for the fourth quarter of 2021:
- Net income and core net income1 of $41.7 million, or $0.84 per share
- Return on average common equity of 17.1% and core return on average tangible common equity1 of 18.8%
- Net interest margin of 2.00%, cost of deposits of 0.12%
- Board declares dividend for the quarter ended December 31, 2021 of $0.44 per share and a new share repurchase program of up to 2.0 million common shares
Financial highlights for the full year 2021:
- Net income of $162.7 million, or $3.26 per share, and core net income1 of $163.6 million, or $3.28 per share
- Return on average common equity of 16.8%, and core return on average tangible common equity1 of 18.7%
- Net interest margin of 2.02%, cost of deposits of 0.11%
- Active capital management with aggregate quarterly dividends of $1.76 per common share and 534,828 shares repurchased
Hamilton, Bermuda – February 14, 2022: The Bank of N.T. Butterfield & Son Limited (“Butterfield” or the “Bank”) (BSX: NTB.BH; NYSE: NTB) today announced financial results for the fourth quarter and year ended December 31, 2021.
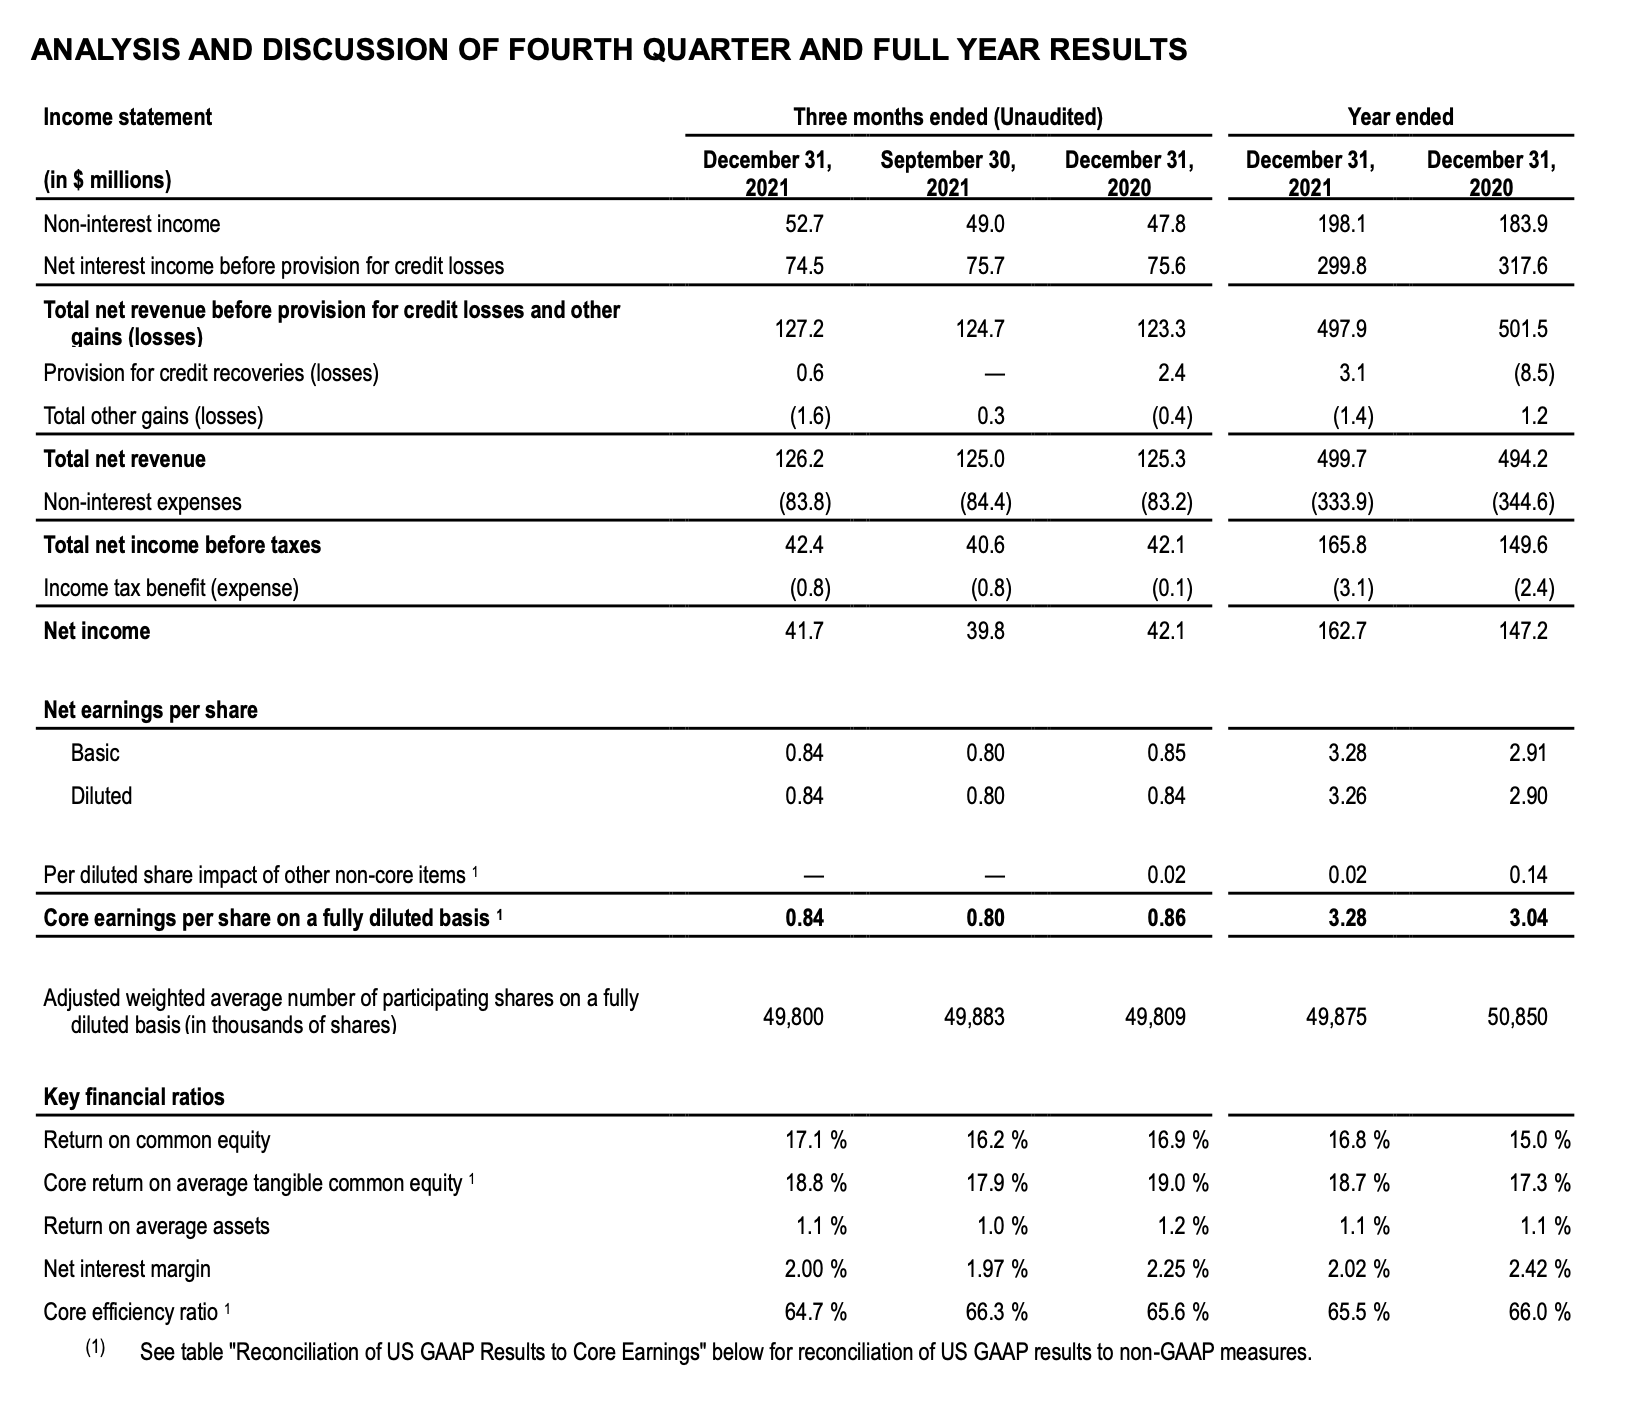
Net income for the year ended December 31, 2021 was $162.7 million, or $3.26 per diluted common share, compared to $147.2 million, or $2.90 per diluted common share, for the year ended December 31, 2020. Core net income1 for the year ended December 31, 2021 was $163.6 million, or $3.28 per diluted common share, compared to $154.5 million, or $3.04 per diluted common share, for the year ended December 31, 2020.
The core return on average tangible common equity1 for the year ended December 31, 2021 was 18.7%, compared to 17.3% for the year ended December 31, 2020. The efficiency ratio for the year ended December 31, 2021 was 65.9% compared with 67.6% for the year ended December 31, 2020. The core efficiency ratio1 for the year ended December 31, 2021 was 65.5% compared with 66.0% for the year ended December 31, 2020.
Current Earnings Release
Michael Collins, Butterfield’s Chairman and Chief Executive Officer, commented, “Butterfield has performed well throughout the past year, as we embraced new opportunities and managed the health and safety challenges of the pandemic. We continued to navigate the very low interest rate environment by improving efficiencies, leveraging technology and enhancing the client experience. With an improved interest rate outlook for 2022, we are well positioned with Butterfield’s historically asset sensitive balance sheet. I look forward to continuing Butterfield’s growth with our strong balance sheet, leading market positions, solid infrastructure, efficient operations and customer centric culture. I would like to thank our staff, clients, the board of directors and all of the stakeholders that continue to contribute to Butterfield’s success.”
Net income and core net income1 for the fourth quarter of 2021 was $41.7 million, or $0.84 per diluted common share, compared to net income of $39.8 million, or $0.80 per diluted common share, for the previous quarter and $42.1 million, or $0.84 per diluted common share, for the fourth quarter of 2020 and core net income1 for the third quarter of 2021 of $40.0 million, or $0.80 per diluted common share, and $42.9 million, or $0.86 per diluted common share, for the fourth quarter of 2020.
The core return on average tangible common equity1 for the fourth quarter of 2021 was 18.8%, compared to 17.9% for the previous quarter and 19.0% for the fourth quarter of 2020. The efficiency ratio for the fourth quarter of 2021 was 64.7%, compared to 66.5% for the previous quarter and 66.3% for the fourth quarter of 2020 and compared to a core efficiency ratio1 for the third quarter of 2021 of 66.3% and 65.6% for the fourth quarter of 2020.
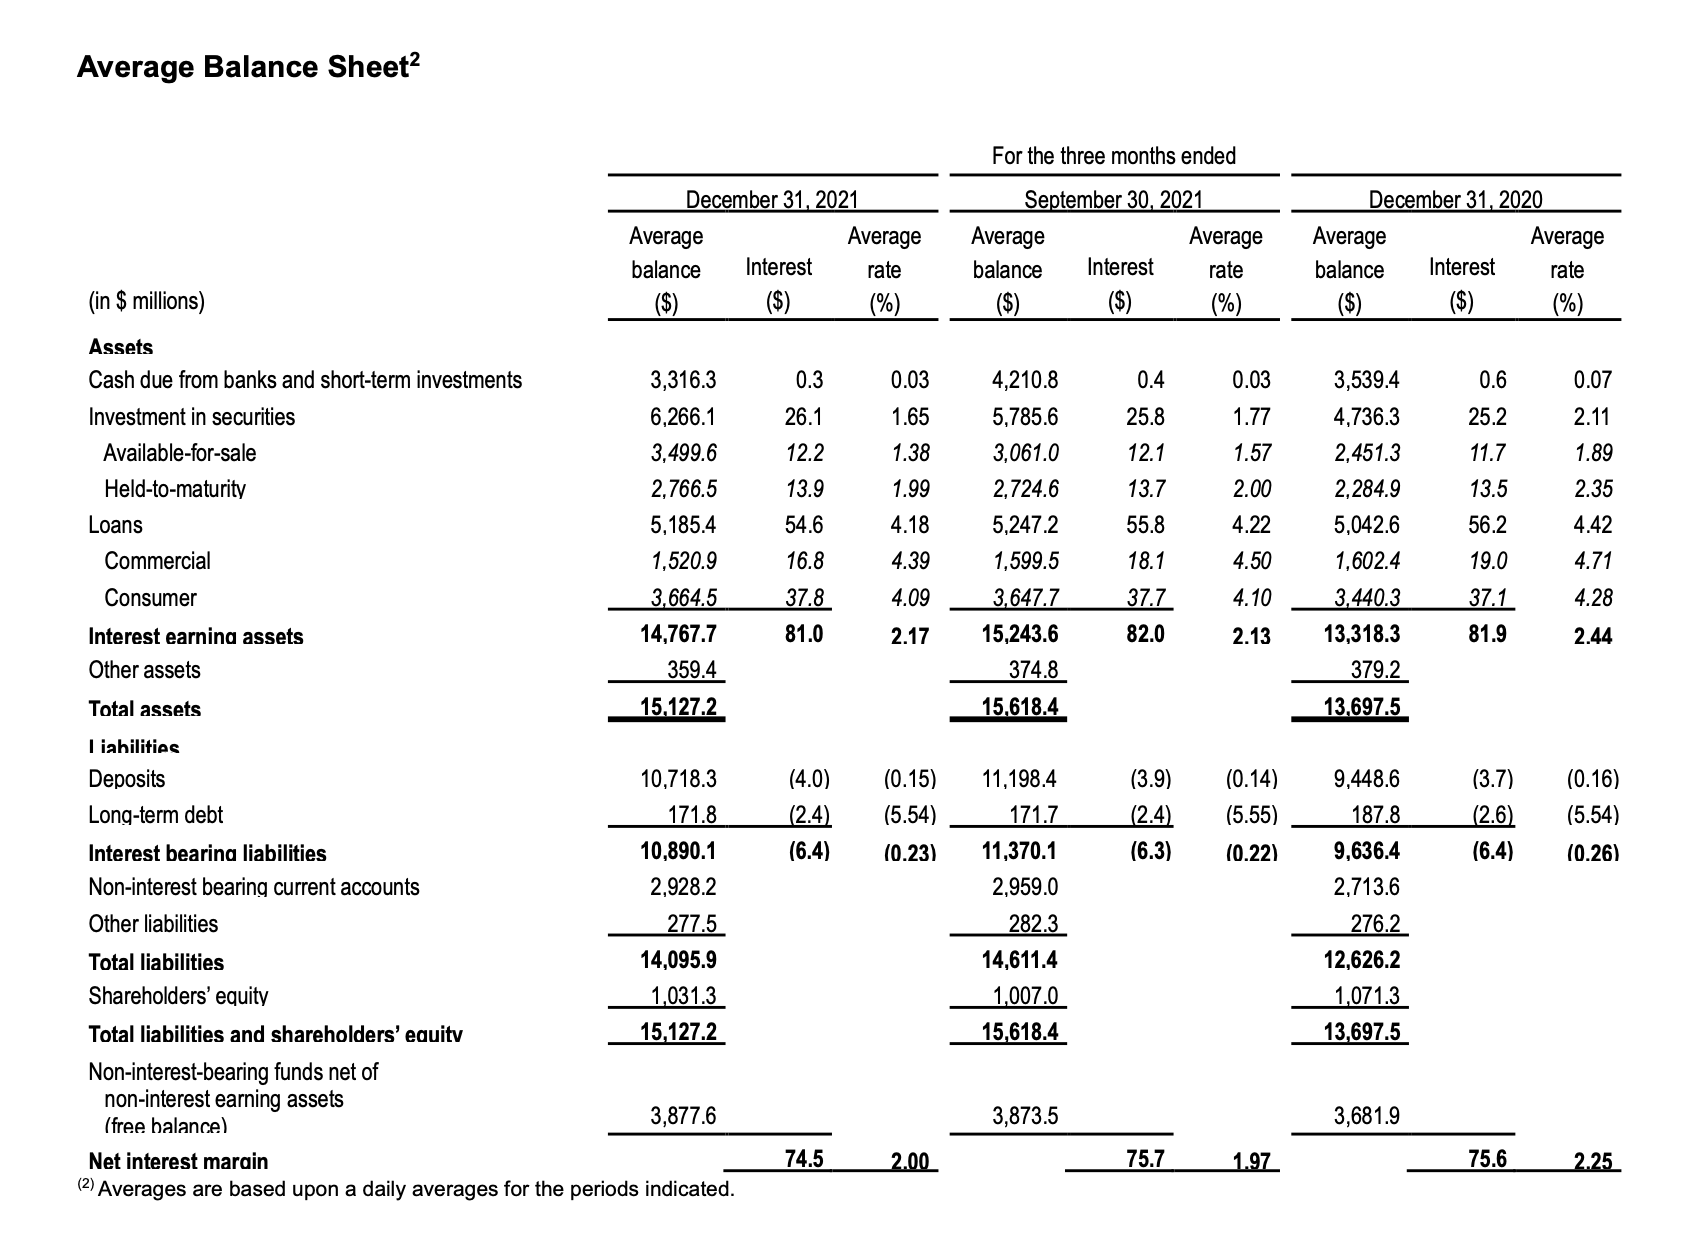
Net interest income (“NII”) for the fourth quarter of 2021 was $74.5 million, a decrease of $1.2 million, compared with NII of $75.7 million in the previous quarter and down $1.1 million from $75.6 million in the fourth quarter of 2020. NII was lower during the fourth quarter of 2021 compared to the prior quarter due to lower average volume of interest earning assets, which was partially offset by an improved asset mix with higher average yields. Compared to the fourth quarter of 2020, NII was lower due to a decrease in average yields, offset by a higher average volume of interest earning assets.
Net interest margin (“NIM”) for the fourth quarter of 2021 was 2.00%, an increase of 3 basis points from 1.97% in the previous quarter and down 25 basis points from 2.25% in the fourth quarter of 2020. NIM in the fourth quarter of 2021 was slightly higher than the prior quarter due to lower deposits decreasing the balance sheet size, and deployment of cash into higher yielding assets. Compared to the fourth quarter of 2020, NIM was lower due to margin declines across interest earning assets, driven by lower US Dollar interest rates.
Non-interest income for the fourth quarter of 2021 of $52.7 million was $3.7 million higher than the $49.0 million earned in the previous quarter and $4.9 million higher than $47.8 million in the fourth quarter of 2020. Non-interest income during the fourth quarter of 2021 increased compared to the prior quarter due to higher revenue across all business lines, with growth in trust, due to new business onboarded and higher activity-based fees, and increased banking revenues from increased card services fees. Compared to the fourth quarter of 2020, non-interest income was up due to increased banking fees due to improved economic activity.
There was a net credit reserve release of $0.6 million for the fourth quarter of 2021, compared to a negligible release in the previous quarter and a release of $2.4 million during the fourth quarter of 2020. The credit release was driven by an improved economic outlook and continuing stable loan performance.
Non-interest expenses were $83.8 million in the fourth quarter of 2021, compared to $84.4 million in the previous quarter and $83.2 million in the fourth quarter of 2020. Core non-interest expenses1 decreased to $83.7 million in the fourth quarter of 2021, compared to $84.2 million the previous quarter and higher than the $82.4 million incurred in the fourth quarter of 2020. Non-interest expenses were lower in the fourth quarter versus the third quarter of 2021 due to lower benefit costs from staff-related restructuring programs, resulting in reduced headcount, and lower sequential spend on technology costs and consulting expenses.
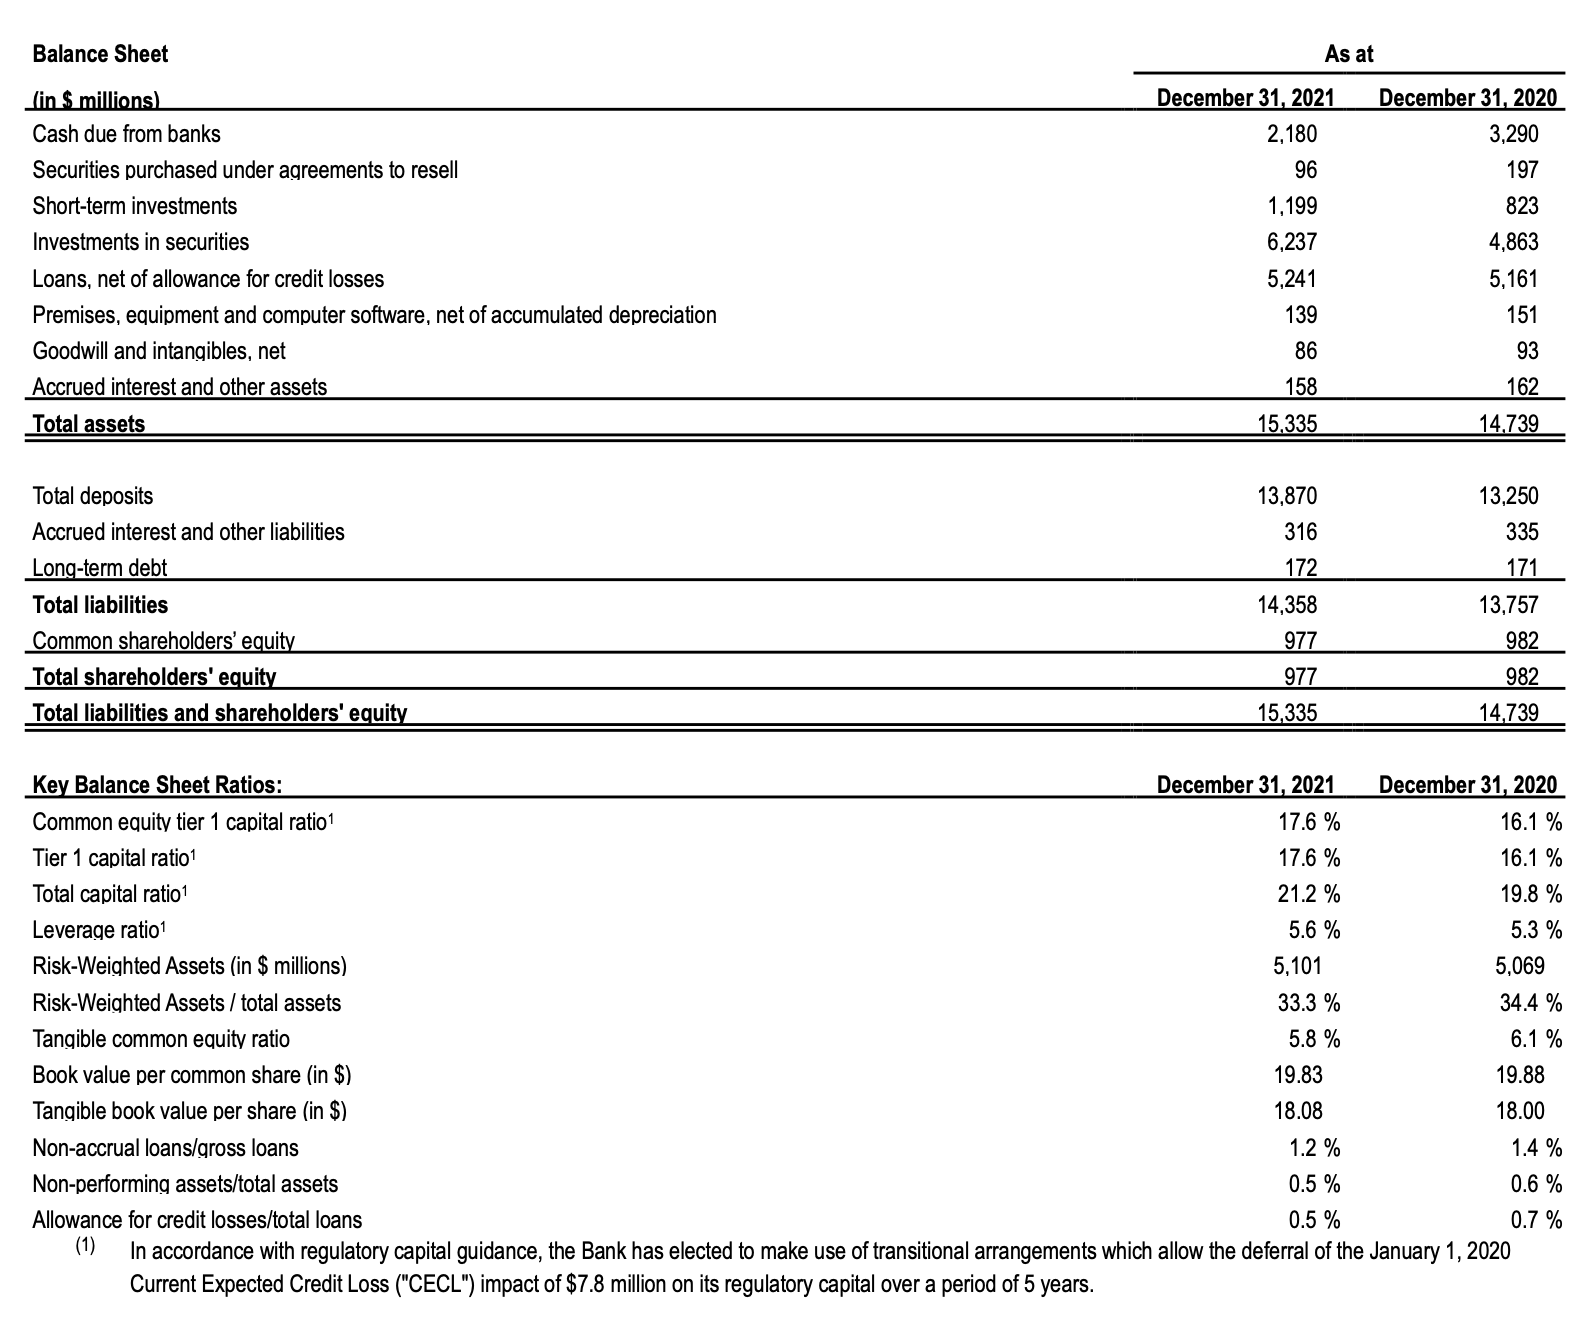
Period end deposit balances increased to $13.9 billion from $13.3 billion as at December 31, 2020. Deposits remained elevated across all jurisdictions. Deposit balances decreased slightly compared to the prior quarter as economies continue to re-open and customers activate their savings.
The Bank continued its balanced capital return policy. The Board again declared a quarterly dividend of $0.44 per common share to be paid on March 14, 2022 to shareholders of record on February 28, 2022. During the fourth quarter of 2021, Butterfield repurchased 0.2 million common shares under the Bank’s expiring share repurchase plan authorization. The Board approved a new replacement share repurchase program on February 14, 2022, authorizing the purchase of up to 2.0 million common shares through to February 28, 2023. The share repurchase program will take effect on March 1, 2022.
The current total regulatory capital ratio as at December 31, 2021 was 21.2% as calculated under Basel III, compared to 19.8% as at December 31, 2020. Both of these ratios remain significantly above the Basel III regulatory requirements applicable to the Bank.
Current Earnings Release
YEAR ENDED DECEMBER 31, 2021 COMPARED WITH THE YEAR ENDED DECEMBER 31, 2020
Net Income
Net Income for the year ended December 31, 2021 was $162.7 million, up $15.5 million from $147.2 million in the prior year.
The $15.5 million increase in net income in the year ended December 31, 2021 was due principally to the following:
- $14.2 million increase in non-interest income due to volume-driven increases in both banking and foreign exchange revenue coupled with higher facility non-utilization fees;
- $17.8 million decrease in net interest income before provision for credit losses due to: a $18.0 million decrease in interest income from investments and cash held at other banks, driven primarily by low global market interest rates following the COVID-19 pandemic; a $9.1 million decrease from interest on loans due to lower rates, the repayment of a few large commercial facilities and paydowns in the higher-yielding Bermuda residential mortgage portfolio; and partially offset by a $9.3 million decrease in interest expense due to lower deposit costs;
- $11.6 million decrease in the provision for credit losses due to both the improvement in macroeconomic forecasts impacting future expected credit loss estimates and reduction in non-performing loans;
- $2.6 million decrease in total other gains (losses) due to losses related to defined benefit settlement accounting in the Channel Islands and UK segment; and
- $12.3 million decrease in staff-related cost due primarily to realizing the benefits from previous restructuring programs.
Non-Core Items1
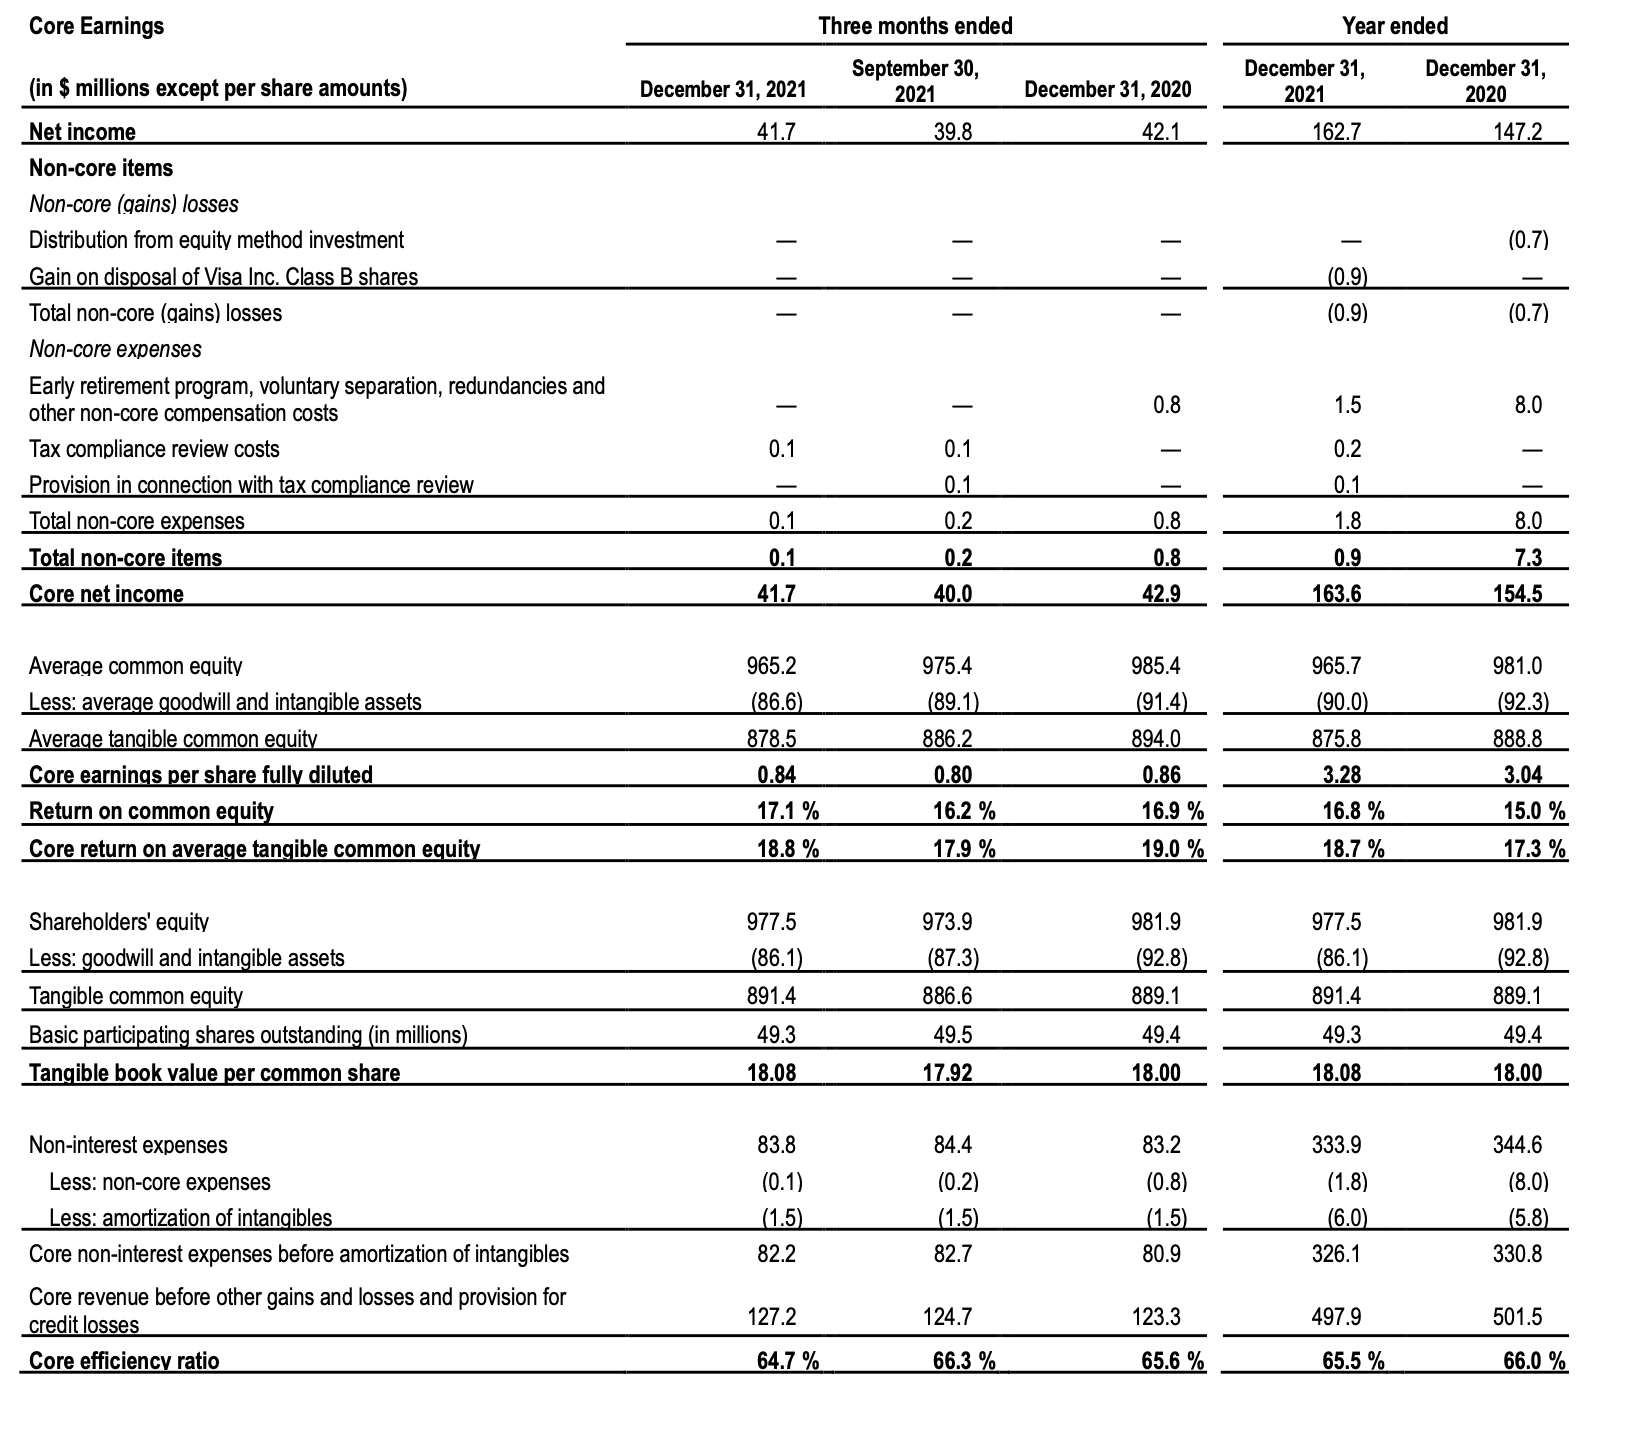
Non-core items resulted in expenses, net of gains, of $0.9 million in the year ended December 31, 2021 compared to expenses, net of gains, of $7.3 million in the prior year. Non-core items for the year included: the gain on the disposal of the Visa Inc. Class B shares; redundancy costs associated with the transfer of Channel Islands banking operations functions from Mauritius to Butterfield’s service center in Canada and Guernsey; and professional fees and final settlement of the US Department of Justice inquiry which commenced in 2013. Management does not believe that the expenses, gains or losses identified as non-core are indicative of the results of operations of the Bank in the ordinary course of business.
QUARTER ENDED DECEMBER 31, 2021 COMPARED WITH THE QUARTER ENDED SEPTEMBER 30, 2021
Net Income
Net income for the quarter ended December 31, 2021 was $41.7 million, up $1.9 million from $39.8 million in the prior quarter.
Current Earnings ReleaseThe $1.9 million increase in net income in the quarter ended December 31, 2021 compared to the previous quarter was due principally to the following:
$3.7 million increase in non-interest income due to higher banking fees driven by seasonally higher consumer spending supporting interchange revenue and higher trust income driven by both new business and higher activity-based fees;
$1.2 million decrease in net interest income before provision for credit losses, driven by reduced loan interest income as a result of lower commercial loan balances;
$0.6 million credit recovery driven by improvements in macroeconomic forecasts;
$1.8 million decrease in total other gains (losses) due to losses related to defined benefit settlement accounting in the Channel Islands and UK segment; and
$0.9 million decrease in staff-related expenses primarily due to redundancy costs recorded in the previous quarter associated with the transfer of non-client facing roles to Butterfield’s service center in Canada, and lower recruitment costs.
Non-Core Items1
Non-core items resulted in a net expense of $0.1 million in the fourth quarter of 2021. Non-core items for the period relate to residual professional fees incurred in relation to the US Department of Justice inquiry.
Management does not believe that comparative period expenses, gains or losses identified as non-core are indicative of the results of operations of the Bank in the ordinary course of business.
Current Earnings Release
BALANCE SHEET COMMENTARY AT DECEMBER 31, 2021 COMPARED WITH DECEMBER 31, 2020
Total Assets
Total assets of the Bank were $15.3 billion at December 31, 2021, an increase of $0.6 billion from December 31, 2020. The Bank maintained a highly liquid position at December 31, 2021, with its $9.7 billion of cash and demand deposits with banks, reverse repurchase agreements and liquid investments representing 63.3% of total assets, compared with 62.2% at December 31, 2020.
Loans Receivable
The loan portfolio totaled $5.2 billion at December 31, 2021, which was $79.9 million higher than December 31, 2020 balances. The Cayman Islands and the Channel Islands and UK segments saw growth in their residential mortgage portfolios, which was partially offset by the repayment of a number of commercial and commercial real estate facilities in Bermuda and the Channel Islands and UK segments during the period.
Allowance for credit losses at December 31, 2021 totaled $28.1 million, a decrease of $6.0 million from $34.1 million at December 31, 2020. The movement was due primarily to collateral sales and charge-off of loans that had previously been provisioned for, and improving macroeconomic forecasts which drive the estimate of expected credit losses.
The loan portfolio represented 34.2% of total assets at December 31, 2021 (December 31, 2020: 35.0%), while loans as a percentage of total deposits decreased to 37.8% at December 31, 2021 from 38.9% at December 31, 2020. The decrease in both ratios were attributable principally to an increase in customer deposits at December 31, 2021 due to corporate deposit increases in Cayman and the Channel Islands, and partially offset by expected corporate deposit outflows in Bermuda.
As of December 31, 2021, the Bank had gross non-accrual loans of $61.0 million, representing 1.2% of total gross loans, a decrease of $11.4 million from $72.5 million, or 1.4% of total loans, at December 31, 2020. The decrease in non-accrual loans was driven by the payoff of residential mortgages and a commercial mortgage in Bermuda and partially offset by a residential mortgage in the UK moving into non-accrual in the fourth quarter of 2021.
Other real estate owned (“OREO”) decreased by $3.4 million from December 31, 2020 to $0.7 million due to the sale of a commercial property in Bermuda during the year.
Investment in Securities
The investment portfolio was $6.2 billion at December 31, 2021, up $1.4 billion from $4.9 billion at December 31, 2020. The increase was due to deployment of assets into the investment portfolio.
The investment portfolio is made up of high quality assets with 100% invested in A-or-better-rated securities. The investment book yield decreased to 1.65% during the quarter ended December 31, 2021 from 1.77% during the previous quarter. Total net unrealized gains on the available-for-sale and held-to-maturity portfolios decreased to $0.9 million, compared with total net unrealized gains of $53.0 million as at the end of the prior quarter and $183.2 million at December 31, 2020, as a result of increased long-term US dollar interest rates.
Deposits
Average deposits were $13.7 billion for the quarter ended December 31, 2021, an increase of $1.7 billion compared to the quarter ended December 31, 2020.
Assets Under Administration and Assets Under Management
Total assets under administration for the trust and custody businesses were $106.4 billion and $36.8 billion, respectively, at December 31, 2021, while assets under management were $5.5 billion at December 31, 2021. This compares with $104.1 billion, $32.4 billion and $5.6 billion, respectively, at December 31, 2020.
Current Earnings Release
Reconciliation of US GAAP Results to Core Earnings
The table below shows the reconciliation of net income in accordance with US GAAP to core earnings, a non-GAAP measure, which excludes certain significant items that are included in our US GAAP results of operations. We focus on core net income, which we calculate by adjusting net income to exclude certain income or expense items that are not representative of our business operations, or “non-core”. Core net income includes revenue, gains, losses and expense items incurred in the normal course of business. We believe that expressing earnings and certain other financial measures excluding these non-core items provides a meaningful base for period-to-period comparisons, which management believes will assist investors in analyzing the operating results of the Bank and predicting future performance. We believe that presentation of these non-GAAP financial measures will permit investors to assess the performance of the Bank on the same basis as management.
Current Earnings Release
Conference Call Information:
Butterfield will host a conference call to discuss the Bank’s results on Tuesday, February 15, 2022 at 10:00 a.m. Eastern Time. Callers may access the conference call by dialing +1 (844) 855 9501 (toll-free) or +1 (412) 858 4603 (international) ten minutes prior to the start of the call. A live webcast of the conference call, including a slide presentation, will be available in the investor relations section of Butterfield’s website at www.butterfieldgroup.com. A replay of the call will be archived on the Butterfield website thereafter.
About Non-GAAP Financial Measures:
Certain statements in this release involve the use of non-GAAP financial measures. We believe such measures provide useful information to investors that is supplementary to our financial condition, results of operations and cash flows computed in accordance with US GAAP; however, our non-GAAP financial measures have a number of limitations. As such, investors should not view these disclosures as a substitute for results determined in accordance with US GAAP, and they are not necessarily comparable to non-GAAP financial measures that other companies use. See “Reconciliation of US GAAP Results to Core Earnings” for additional information.
Forward-Looking Statements:
Certain of the statements made in this release are forward-looking statements within the meaning of the U.S. Private Securities Litigation Reform Act of 1995. Forward-looking statements include statements with respect to our beliefs, plans, objectives, goals, expectations, anticipations, assumptions estimates, intentions, and future performance, including, without limitation, our dividend payout target, and involve known and unknown risks, uncertainties and other factors, which may be beyond our control, and which may cause the actual results, performance, capital, ownership or achievements of Butterfield to be materially different from future results, performance or achievements expressed or implied by such forward-looking statements due to a variety of factors, including worldwide economic conditions and fluctuations of interest rates, a decline in Bermuda’s sovereign credit rating, the successful completion and integration of acquisitions or the realization of the anticipated benefits of such acquisitions in the expected time-frames or at all, success in business retention and obtaining new business, the impact of the COVID-19 pandemic, the scope and duration of the pandemic, actions taken by governmental authorities in response to the pandemic, the eventual timing and duration of economic stabilization and recovery from the pandemic and other factors. Forward-looking statements can be identified by words such as “anticipate,” “assume,” “believe,” “estimate,” “expect,” “indicate,” “intend,” “may,” “plan,” “point to,” “predict,” “project,” “seek,” “target,” “potential,” “will,” “would,” “could,” “should,” “continue,” “contemplate” and other similar expressions, although not all forward-looking statements contain these identifying words. All statements other than statements of historical fact are statements that could be forward-looking statements.
All forward-looking statements in this disclosure are expressly qualified in their entirety by this cautionary notice, including, without limitation, those risks and uncertainties described in our SEC reports and filings. Such reports are available upon request from Butterfield, or from the Securities and Exchange Commission (“SEC”), including through the SEC’s website at https://www.sec.gov. Any forward-looking statements made by Butterfield are current views as at the date they are made. Except as otherwise required by law, Butterfield assumes no obligation and does not undertake to review, update, revise or correct any of the forward-looking statements included in this disclosure, whether as a result of new information, future events or other developments. You are cautioned not to place undue reliance on the forward-looking statements made by Butterfield in this disclosure. Comparisons of results for current and any prior periods are not intended to express any future trends or indications of future performance, and should only be viewed as historical data. BF-ALL
About Butterfield:
Butterfield is a full-service bank and wealth manager headquartered in Hamilton, Bermuda, providing services to clients from Bermuda, the Cayman Islands, Guernsey and Jersey, where our principal banking operations are located, and The Bahamas, Switzerland, Singapore and the United Kingdom, where we offer specialized financial services. Banking services comprise deposit, cash management and lending solutions for individual, business and institutional clients. Wealth management services are composed of trust, private banking, asset management and custody. In Bermuda, the Cayman Islands and Guernsey, we offer both banking and wealth management. In The Bahamas, Singapore and Switzerland, we offer select wealth management services. In the UK, we offer residential property lending. In Jersey, we offer select banking and wealth management services. Butterfield is publicly traded on the New York Stock Exchange (symbol: NTB) and the Bermuda Stock Exchange (symbol: NTB.BH). Further details on the Butterfield Group can be obtained from our website at: www.butterfieldgroup.com.
Investor Relations Contact:
Noah Fields
Investor Relations
The Bank of N.T. Butterfield & Son Limited Phone: (441) 299 3816
E-mail: [email protected]