Gauteng’s Omicron wave is already peaking. Why?
By David Wallace-Wells From Intelligencer
In Gauteng, South Africa’s Omicron epicenter, the wave seems to be cresting. In other parts of the country, too, the terrifyingly fast rise of the new variant appears already to be slowing and even receding. This is very encouraging, since it suggests that Omicron waves elsewhere in the world may also be, if disorientingly fast, also mercifully short. But it is also a bit confusing, given that the wave has peaked well before anything like it had fully penetrated the local population, and given that everything we know about the new variant is that neither infection-acquired immunity nor two vaccine doses do much at all to stop transmission.
But this is not a phenomenon peculiar to Omicron. At earlier stages of the pandemic, in sometimes less dramatic ways, other waves have crested and declined much before crude models might’ve suggested the vulnerable population had been exhausted. Sometimes, this has led to premature predictions of early herd immunity: Last summer, Youyang Gu, who’d distinguished himself as a modeler of the pandemic, suggested that in parts of the U.S., at least, communities could be reaching “temporary herd immunity” with exposure levels between 10 percent and 35 percent. More recently, Philippe Lemoine has argued that population structure is a hugely underappreciated factor in pandemic spread, and that we shouldn’t keep turning back to models based on simple inputs like doubling time (how long it takes caseloads to grow by a factor of two) or Rt (how many people each infected person infects, on average).
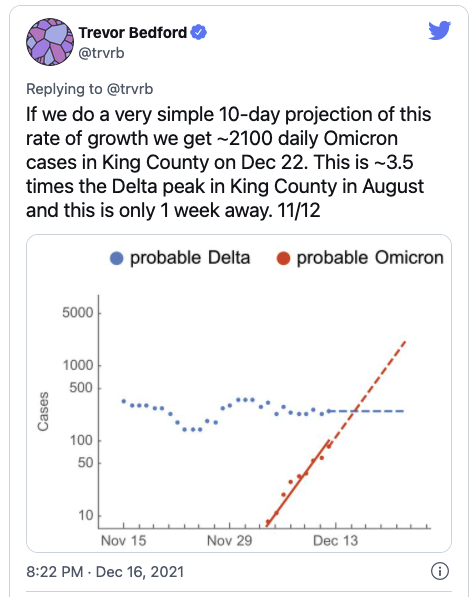
On Friday, I spoke with Trevor Bedford, of Seattle’s Fred Hutchinson Cancer Research Center, about how to make sense of this phenomenon, and how comfortably we can count on the Omicron waves taking a similar turn, on a similar timetable, elsewhere in the world.
I’m curious to talk to you about the state of play generally, but I wanted to start with what we’re seeing in Gauteng, where the wave already appears to be cresting, though many fewer people appear to have been infected than are vulnerable — especially when you consider that, while people who’ve been infected or vaccinated already may be protected against severe disease, there is hardly any protection against infection per se. Which means, in terms of infection, this is almost a virgin population, so to speak. How do you understand that?
Yeah, it’s a really good question. I’ve been looking into this a bit. The basic idea is that we can measure Rt, and there’s a very simple equation that will convert Rt into your population attack rate: how many people will be infected in the entire epidemic wave. That projection is quite linear. With Delta and the Delta Rt of 1.5 — when it was coming in — I was able to convert that to an attack rate that ultimately matched what we saw. I did that by assuming it would really be mostly targeting the people that aren’t vaccinated or infected previously.
With Omicron, and its initial Rt being three-ish, that same equation should give you something like 90 percent of the population infected. But from what we’ve seen in South Africa, it seems like the wave is crashing well before that. So something is going on.
What do you think it is?
The options that I have been thinking about — there’s five of them. They’re non mutually exclusive. So to go through …
Please.
First, there’s the simple limit to testing capacity. As things increase, our testing capacity doesn’t increase as fast, and so we’re missing more and more cases. That can give you a distorted picture — it could look like a plateau in Gauteng, but you could imagine it’s really a much higher crest.
Like the top of a mountain has been chopped off by bad testing.
I also bet we can expect a lot more underreporting of Omicron, compared to previous wave, because it’s more mild, either through existing immunity or through actual reduction of intrinsic severity. And if, on average, you’ve reduced the severity of cases, there’d be a lot of people that don’t bother to come to the hospital or to get tested. And so as a rough guess, you might go from like one in ten cases reported in South Africa to one in 20 or even one in 30 cases — that wouldn’t seem unreasonable to me. And that makes it so that at the same caseload of Delta versus Omicron you could actually have three times as many infections with Omicron.
We could also have a change in generation interval. If we have Omicron kind of doubling at this very fast two- or three-day rate, you don’t actually have to have Rt be three. You could have actually just made the whole thing faster without having the number of secondary infections being much higher. And we don’t have no way of knowing that at this moment.
The last two are, it might not be that the entire population is susceptible to Omicron. Maybe half the population is susceptible. And then, finally, I think there’s a network effect — that as things kind of percolate through the community, you can imagine those transmission chains circling back on themselves and hitting someone that has already been exposed.
Rather than continue to spread outward from the initial case, in other words, the fact of natural social networks and limited niches means that chains of transmission can’t continue indefinitely.
And so that would make these waves slow as they reach some per-capita size, just a natural epidemiological phenomenon. Take something from each of those five categories, and I think you have the answer.
The first three things you talked about are phenomena that are to some degree particular to Omicron and South Africa. The last two are ones that we can also apply to these earlier waves. When we think about the Delta wave in the U.K., for instance, should we assume that when that wave peaked and crested that something like the full vulnerable population had been reached by Delta?
No. With Rt you can actually calculate what proportion of the susceptible population should get this. The way that I was thinking about Delta was that not the entire population was susceptible, because a lot of the population was previously infected or had two vaccine doses and hadn’t yet waned so much. And so that will give you maybe 50 percent of the population that’s actually susceptible. And then an RT of 1.5, which is what Delta was coming in with, will give you maybe a 30 percent attack rates.
One of the fundamentals of this dynamical modeling field is that epidemics crash not when they’ve infected everyone but when your number of secondary infections is less than one, when Rt falls below one. So even if we have an initial Rt of two, the numbers are quite big, but you don’t infect the whole population. You infect almost 80 percent of the susceptible population. With an Rt of three you may infect 90 percent of the susceptible population. But this is without any of those network effects. It’s just a model of free mixing, where people encounter other people at an even rate.
And then how do we account for our experience with Delta in the U.S.? We had a peak, we had a decline, but it didn’t get anywhere near zero. We’re still going through the Delta wave. It was a similar dynamic in the U.K.: Fast rise, a peak, followed by what is at first a rapid decline, sort of symmetrical to the rise, but then it flattens out and keeps going, rather than disappearing to zero.
For Delta, my best guess is that kind of slowing down and then picking back up again was due to a combination of continued waning — where boosters and third doses weren’t being given that rapidly, and we were getting farther and farther out from the initial vaccination — combined with seasonality. That would be my explanation.
Relatedly, going off things that Imperial College has done, we can expect that the AstraZeneca vaccine in the U.K. to have less protective effect than Pfizer. And that can explain the kind of systematically high levels of Delta circulation in the U.K., compared to perhaps the U.S.
Before we move on, can I ask you one question about severity with Delta?
Yes, for sure.
This is something that has been preoccupying my thinking for months now, and I’ve asked a lot of people and honestly haven’t gotten a particularly good answer. Now, of course, cases are imperfect measures of true infections, but the case-fatality rate for Delta here in the U.S. is basically the same as it was in the winter surge, before vaccination. And though you can quibble with the CDC numbers, even it’s only 75 percent of American seniors that have gotten “fully” vaccinated, and even if that meant there were enough unvaccinated and vulnerable people out there you could get 1,000 or 2,000 deaths a day, you would also expect that same number of deaths would imply or require a much higher level of cases than we have.
And in fact, that has been the dynamic in the U.K. and many other countries, which are often a bit better vaccinated than the U.S., but not in a different ballpark vaccination level. There, they’ve seen this quite dramatic decoupling, even through Delta — when there has been an uptick in severe cases and death, it has been accompanied by much higher caseloads. Why haven’t we seen that in the U.S.?
I don’t have a super obvious explanation there. If we look at places like King County, Washington, where we have decent data, 30 percent of infections before Omicron were breakthrough infections. And so with the U.S. having less vaccination than other places, we can still have Delta percolating through primarily the unvaccinated population. And so you can go from a case-fatality rate of 1.75 only down to 1.25 because still a large fraction of your cases are in the unvaccinated population.
Fair enough. But the other dynamic that applies to this is that we have an incredible age skew in terms of mortality risk and we have a real age skew in terms of vaccination as well, with the elderly much more likely to be vaccinated. Which means that the unvaccinated population in September and October of this year was really different, with a different age structure, than the unvaccinated population in the winter surge, since a huge fraction of the elderly are no longer in the unvaccinated group. So what we’re seeing is not just spread primarily through the unvaccinated but through an unvaccinated population that is fundamentally different, which is to say younger, because we’ve done a relatively good job of vaccinating the elderly. And because mortality risk skews so dramatically with age I would expect that an unvaccinated population whose median age is 30 would have a much, much different case-fatality rate than one whose median age was 40. But it’s not. It’s basically the same.
Yeah. It’s a super good question. I’ve been looking at this as well and I don’t have a great answer. For CFR we get a really precipitous decline in March and April — this is due to the vaccine rollout, targeting older individuals first. And so it really drops. And then it comes back up as vaccines become more equitable among age groups by the time we get to June. So I think some of it’s there.
For over-65’s, we can see the big peak last winter — but not as bad as in Delta, thanks to vaccination. Whereas if we look in the 35 to 44 category, there’s just a much larger fraction of 35 to 44 year olds who are getting COVID in September and fewer of them vaccinated so you can still get this big jump in mortality. But about your central question of why given what we know about how strong the age-mortality effect is, I would still have expected CFR to change much more dramatically.
One reason why this is sort of relevant now, I think, is that it raises the question of how much we can extrapolate from the U.K. experience with Omicron to what we can expect here. So let’s talk a little bit about what you’re seeing in South Africa and to some degree and in the U.K. and how you think we should think about it in terms of what’s likely it happen in America.
The severity is something that’s been frustratingly hard to get a read on. If we recall back to spring 2020, we were arguing with John Ioannidis and everyone else — there was this vast range of severity that was being argued about at that time. So I can understand why it’s taking longer to resolve this time around as well.
And now we have to factor in the question of immunity, too.
Exactly. There, it was mostly about the denominator. Now it’s kind of also about the denominator, but we also have to separate out people with immunity from people without. And I think that we definitely have an effect from immunity. It might also be intrinsically less severe. I think that’s entirely entirely possible, but also that what we’re seeing might be explained entirely by immunity. I don’t have a good guess between those two. But if we’re at like 80 percent-ish of the population with some kind of immunity in the U.S., and over 90 percent in the U.K., we can expect this wave to be more mild, because a larger fraction of cases will be reinfections or breakthroughs.
And so I would strongly suspect that on a case-fatality basis, the rate will be much lower with Omicron. But we’ll have a lot of cases, too, because now we have all of these individuals available to the virus that were weren’t available before.
Because of reinfection, you mean, and how effective Omicron is at getting to those who’ve already been sick.
So I haven’t been able to get a good read on what to expect for severity. I can expect caseloads that are huge. I can easily expect a 50 percent attack rate from Omicron. I can easily expect that.
That’s 160 million cases.
But I don’t have a great read on severity. It seems to me like the most realistic numbers we’ve seen are from the modeling report from the London School of Hygiene and Tropical Medicine. They have these different scenarios. In their pessimistic scenario, they have about as many deaths as the previous winter; in the optimistic scenario, many fewer.
I think it’s about 30 percent in that optimistic scenario. But it doesn’t seem to reflect any reduced severity of the disease, does it?
I think they were assuming it was the same, that there’s no intrinsic difference and we can just explain the observed difference via immunity.
Does that seem plausible to you? Some of the numbers that we’ve seen today — the hospitalization rate may have fallen by 91 percent, the death rate of people in hospital may have fallen by two-thirds — do you think you could get that large in effect just through additional acquired immunity? This is just compared to the last wave, so it’s not all that long ago. Could you get that scale of an effect just through acquired immunity? It would seem to be that reduced virulences has to be at least a part of the story, no?
Yeah, if those numbers are real, then I think you would have to have lower intrinsic severity.
So what does that tell us about what to expect in the U.S.? The U.K. data decoupled, with much faster rate of case growth than hospitalization, and the U.S. did not. If we see in the next couple of weeks a really mild wave in the U.K., can we safely assume the same will be true here?
No, I don’t think so. At this point, I would’ve wanted that CFR to diverge. We haven’t seen it diverge. I would think that we’re getting close — decently close — to 80 percent population immunity in the U.S., since even though we’ve had lower vaccination rate the virus makes up for that by infecting more people. That level of protection should be blunting things, but it won’t be blunting things quite as much as we’d expect in the U.K. where they’ve had more vaccination.
But things are growing quickly enough that London only appears five days ahead of Seattle, so we’re not going to have much lead time. What I’m hoping for from the U.K. more is better data. They do amazing work that they can actually tie together individual infections to outcomes.
Which could allow us to track severity a little more easily, since we wont be so confused about questions of population immunity. But the speed thing is a bit distressing. I’ve been thinking about it a lot, that the models aren’t all that useful to us, right now, given how quickly the actual cases are coming. Anything else you’d suggest we think about in contemplating what’s about to come?
Maybe two small thoughts. One is, we’re doing a lot of arguing over intrinsic severity.
Whether what we’re seeing reflects immunity or reduced severity.
But in some sense, it doesn’t really matter. This is going to be less severe, either because of immunity or intrinsic severity or both. What matters much more than what drives that reduced severity is how reduced it is. People are arguing about those factors like, if it is intrinsically less severe, that means we don’t need to worry about it.
But the difference between being 30 percent less severe and 30 times less severe is really, really important.
Yeah, exactly. So the scale of reduction is much more important than the mechanism.
And then two is, even if we’re not completely at endemicity, we’re pretty close. And so this may be, effectively, what endemicity looks like, and we can see how bad that feels. If we continue to have things like Omicron continuing to emerge, we can maybe expect this every year.
For more on this story go to: INTELLIGENCER
SIGN UP FOR THE INTELLIGENCER NEWSLETTER
Daily news about the politics, business, and technology shaping our world.