Cayman Islands Report on Foreign Transactions of Residents Released
 The Cayman Islands’ Balance of Payments (BOP) and International Investment Position (IIP) Report 2015 has just been released. The report presents statistical summaries of the economic and financial transactions between residents of the Cayman Islands and the rest of the world. The statistics are generated from survey returns of local businesses and other organizations as well as data provided by the Cayman Islands Monetary Authority (CIMA).
The BOP shows that in 2015, the country incurred an overall deficit in the Current Account, comprising of payments and receipts for goods and services, investment income, workers’ remittances and other income, amounting to CI$629.6 million. The deficit was partly funded by a net financial inflow or borrowings from abroad amounting to $478.9 million.
The IIP shows the value and composition of outstanding foreign assets and liabilities of residents (mainly financial corporations and a few non-financial corporations) at the end of the year. The latter also represents the total investments of non-residents in the Cayman Islands.
In 2015, the total financial assets abroad of residents reached approximately CI$127.2 billion. These consisted of direct investments ($21.5 billion); portfolio investment ($25.1 billion); financial derivatives ($3.0 billion); currencies, loans, deposits and other investments ($77.4 billion); and reserve assets ($112.0 million).
Other information may be obtained from the Report posted at the Economics and Statistics Office website www.eso.ky
From the Report (not complete)

1. EXECUTIVE SUMMARY
1.1 The Cayman Islands’ System of National Accounts Report 2015 presents the gross domestic product (GDP) estimates for the period 2011–2015. The estimates were calculated using both the production and income approaches. The production approach to estimating GDP is obtained by summing the value added of all industries within the economy (i.e. the gross value of outputs minus the value of intermediate consumption). The income approach is obtained by summing the income earned by the factors of production, i.e. compensation of employees, consumption of fixed capital, taxes less subsidies on production and imports and operating surplus/mixed income. The income approach estimates GDP in current purchasers’ prices.
1.2 Gross Value Added (GVA) is defined as the difference between the gross output (essentially sales) of producers and the value of their intermediate inputs (goods and services that are used up in the production process, excluding fixed assets whose consumption is recorded as consumption of fixed capital).
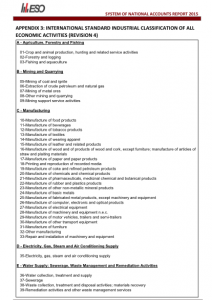
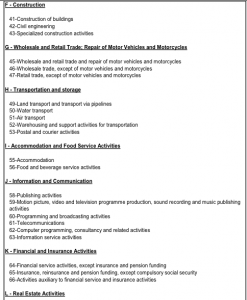
1.3 The concept of GDP for the economy as a whole is that it should measure the total GVA for all producers resident in the economy. The overall estimate of Cayman Islands’ GDP comprises the value added of 18 industries as classified using the International Standard Industrial Classification (ISIC) Revision 4. The data shown are the most recent estimates of GDP and include any revisions (to previously published data) due to revised figures obtained from businesses during the most recent Annual National Accounts Survey. In general, figures for the most recent year (2015) are to be regarded as preliminary.
1.4 GDP estimates in this report are presented in both basic prices and purchaser’s (market) prices. The main difference between basic and purchasers’ price is the taxes less subsidies (or net taxes) on products. A tax on a product is a tax that is payable per unit of some good or service. The tax may be a specific amount of money per unit or a specified percentage of the value of the goods or services. In the Cayman Islands, taxes on products are primarily taxes and duties on imports, and other taxes on product excluding taxes and duties on imports (e.g. hotel occupancy tax).
1.5 The 2015 nominal (current) basic price GDP for the Cayman Islands stood at CI$2,844.5 million, resulting in an estimated per capita nominal GDP of CI$48,167.4.
1.6 Real GDP at basic price (i.e. GDP at constant 2007 prices or GDP adjusted for inflation) stood at CI$2,621.8 million in 2015. The corresponding per capita GDP for 2015 was estimated at CI$44,397.2.
1.7 The domestic economy recorded another year of growth in 2015 when it expanded by 2.8 percent compared to 2014. This fifth consecutive year of growth added to the 1.2 percent growth recorded in 2011, 1.3 percent in 2012, 1.5 percent in 2013 and 2.2 percent in 2014. The performance in 2015 continues the acceleration in economic activity since 2011, and was broad‐based as all industries posted growth.
1.8 In terms of the growth rate of constant price GDP in 2015, the top six performing industries are: (i) mining & quarrying (8.4%); (ii) human health & social work (6.9%); (iii) construction (6.1%); (iv) education services (3.9%); (v) professional, scientific & technical activities which includes legal and accounting services (3.7%); and (vi) administrative & support services activities which consists mainly of security and car rental services (3.4%). The financial & insurance services industry posted growth of 2.1 percent in 2015, after growing by 0.8 percent in 2014 and 0.4 percent in 2013.
1.9 The Average Annual Growth Rate (AAGR) over the five‐year period (2011‐2015) showed average annual constant price GDP growth of 1.8 percent for the total economy. The highest average expansion over the period was recorded by the human health & social work industry, which posted average growth of 3.6 percent. This was followed by agriculture & fishing (3.5%); hotels & restaurants (3.3%); administrative & support services activities (3.0%); and professional, scientific & technical activities (3.0%). Financial and insurance services expanded by an average rate of 1.1 percent over the period, while construction services expanded by 1.8 percent. All industries posted positive average growth rate for the review period with the information and communication industry realizing the lowest average expansion of 0.5 percent.
1.10 While posting a marginal decline in its direct contribution to real GDP in 2015, the financial and insurance services industry maintained its position as the largest single contributor, accounting for 41.0 percent of total GDP. This represents a continued decline in the contribution of the industry from the 42.2 percent recorded for 2012. The other industries making up the top six contributors in 2015 include: (i) professional, scientific & technical activities, which includes legal and accounting services (14.5%); (ii) real estate activities (8.5%); (iii) wholesale & retail trade (8.2%); (iv) public administration & defense which consists primarily of central government operations (7.5%); and (v) hotels and restaurants (5.8%). There was no change in the relative ranking of the industries within the Cayman Islands’ economy in 2015 when compared to 2014.
1.11 All income components of GDP recorded growth in 2015 when compared to the previous period with the exception of taxes (less subsidies) on production and imports1 which declined by 1.5 percent. The highest increase was recorded by operating surplus/mixed income2 (4.9%), followed by compensation of employees3 (3.6%) and consumption of fixed capital4 (0.6%).
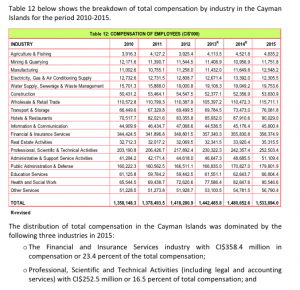
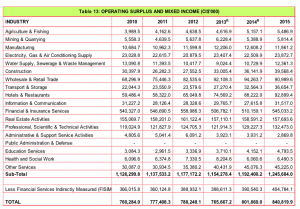
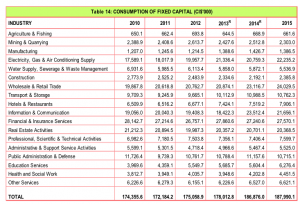
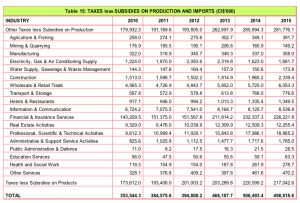
1.12 In 2015, total compensation of employees increased to CI$1,533.9 million or 50.1 percent of GDP; total operating surplus/mixed income reached CI$840.8 million or 27.5 percent of GDP; consumption of fixed capital was estimated at CI$188.0 million or 6.1 percent of GDP while total taxes on production and imports (less subsidies) was valued at CI$498.8 million or 16.3 percent of GDP.