Cayman Islands: Butterfield Reports First Quarter Profit
![]() Q1 2016 core earnings(1) of $36.0 million, up $7.0 million (24.1%) over Q1 2015
Q1 2016 core earnings(1) of $36.0 million, up $7.0 million (24.1%) over Q1 2015
Q1 2016 net income of $26.8 million, down $1.2 million (4.3%) over Q1 2015(3)
Core cash earnings per share of $0.07, up $0.02 from $0.05 in Q1 2015(2)
Diluted earnings per share of $0.05, up $0.01 from $0.04 in Q1 2015(2)(3)
Asset quality strong and improving, with non-accrual loans down from year-end to 1.2% of total loans
Board declares interim dividend of $0.01 per common share
Hamilton, Bermuda─25 April 2016: The Bank of N.T. Butterfield & Son Limited (“Butterfield” or the “Bank”) today announced core earnings for the first quarter ended 31 March 2016 of $36.0 million, an improvement of $7.0 million compared to $29.0 million earned in the same quarter a year ago. The core cash earnings per share increased $0.02 to $0.07 per share. The core cash return on average tangible common equity improved to 24.5% in the first quarter of 2016, compared to 16.7% in the first quarter of 2015.(2) Reported net income for the first quarter was $26.8 million ($0.05 per share on a fully diluted basis) compared to $28.0 million ($0.04 per share on a fully diluted basis) in the same quarter a year ago, down $1.2 million.
Michael Collins, Butterfield’s Chief Executive Officer, said, “Butterfield delivered another quarter of strong financial performance with core earnings of $36.0 million, an increase of 24% over the first quarter of 2015. Core cash earnings per share rose to $0.07, up from $0.05 in the first quarter of the prior year. We continue to generate steadily growing and predictable earnings through wealth management acquisitions, deposit growth in community banking, and cost reductions across the Group. Our dual focus on revenue growth and expense management, while making significant investments in compliance, will position Butterfield for continued success as our core markets recover and the period of historically low interest rates comes to a natural conclusion.
“Non-interest income for the first quarter improved modestly, while net interest income grew on higher revenue from the corporate loan portfolio and lower deposit costs across the Bank. We saw increased demand for loans in Cayman, but loan demand overall remains subdued across our major markets. In the absence of sustained loan growth, the Bank will alternatively deploy capital in wealth management acquisitions and the investment portfolio.
“During the first quarter, we restructured our management team in an effort to improve decision making and communication across the Bank. We will continue to rationalise our business model, focusing on expansion in key international financial centres where we have expertise and scale. We are in the process of winding down our sub-scale deposit taking and investment management business in the UK, a project which will be completed in Q3 2016. At the same time, we are increasing our wealth management market share in Bermuda with the planned acquisition of HSBC’s Private Banking Trust and Investment Management businesses which is expected to close shortly. This wealth management acquisition will substantially increase Butterfield’s deposits, assets under administration, and assets under management.
“In the final quarter of 2015, we incurred significant non-core expenses associated with the wind-down of the London bank and the management restructuring. As planned, we recognised some additional charges associated with these projects in Q1 2016, but these initiatives will improve our run rate and predictability of earnings going forward.
“We continue to deploy capital to directly benefit shareholders through dividend payments and share buy-backs. During the quarter, we repurchased $0.3 million worth of common shares, and the Board declared common dividends of $0.01 per share from first quarter earnings.
“In March, Butterfield again received Global Finance’s award for Best Bank in Bermuda in its annual listing of the world’s best developed market banks.”
Commenting on Butterfield’s first quarter financial results, Michael Schrum, Chief Financial Officer said, “Overall, Butterfield’s balance sheet is stable and highly liquid. Paydowns within the consumer loan portfolio were largely offset by new Sovereign and public sector lending on the institutional side.
“Loan quality continues to improve, with minimal movements of loans into non-accrual status and the effects of ongoing remediation, refinancing and liquidation of existing problem loans leading to their removal from non-accrual status. Non-performing loans, which include gross non-accrual loans and accruing loans that are past due by 90 days or more, were broadly stable during the quarter
“The Bank benefitted from the US Federal Reserve’s December 2015 increase of the benchmark US dollar rate through improved returns on our investment portfolio and the impact of associated rate adjustments implemented in our corporate lending portfolio. Combined with lower deposit expenses incurred during the quarter from both rate and volume changes, and the effects of the exchange of one tranche of long-term debt in favour of lower, floating rate instruments, we saw an increase in net interest income before provision for credit losses during the quarter of $3.5 million.
“Non-interest income improved by $0.4 million from increased banking fees and foreign exchange transaction volumes, offset by small declines in asset management custody revenues.
“The increases in net interest income and non-interest income, offset by a slight increase in non-core expenses associated with our consultancy spending and taxes payable in the UK, drove an improvement in core earnings of $7.0 million year-on-year against a backdrop of weak economic recovery and continued low interest rates. The realisation of non-core expenses and provisions during the quarter—associated with the continued wind-down of our UK bank, costs related to the pending acquisition of HSBC’s wealth management businesses in Bermuda, and severance and retirement charges associated with the management restructuring project effected during the quarter—led to a reduction of net income by $1.2 million versus the first quarter of 2015.”
Capital Management
Consistent with global banking industry reform, Bermuda banks began the implementation of the Basel III framework during 2016, which is improving the Bank’s loss absorption capabilities, introducing new regulatory liquidity rules and will continue to make the Bank stronger and more resilient.
As the Bank has exceptional organic capital generation and very high quality capital, the Bank is in a robust position and can continue to serve customers with new loans and other products, as well as meet emerging regulatory capital requirements.
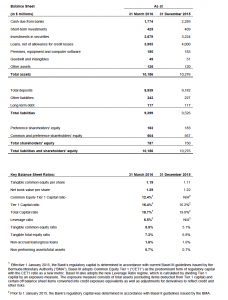
The current total capital ratio as at 31 March 2016 was 18.7% as calculated under Basel III, which is effective for reporting purposes starting 1 January 2016. As of 31 December 2015, we reported our total capital ratio under Basel II at 19.0%. Both of these are significantly above regulatory requirements.
The Board remains committed to a balanced capital return policy and declared quarterly dividends of $20 per share on the Bank’s 8% non-cumulative perpetual voting preference shares, to be paid on 15 June 2016 to preference shareholders of record on 1 June 2016.The Board also declared an interim dividend of $0.01 per common share to be paid on 27 May 2016 to shareholders of record on 13 May 2016.
Share Repurchase Activity
Under the Bank’s share buy-back programmes, the total shares acquired or purchased for cancellation during the quarter ended 31 March 2016 amounted to 0.2 million common shares to be held as treasury shares at an average cost of $1.64 per share (total cost of $0.3 million). There were no preference shares repurchased during the quarter ended 31 March 2016.
On 19 February 2016, the Board approved, with effect from 1 April 2016, the 2016 common share buy-back programme, authorising the purchase for treasury of up to eight million common shares.
(1) See below for reconciliation of US GAAP results to core earnings.
(2) Significantly augmented by the CIBC share repurchase in April of 2015. Please see the press release for the year-ended 31 December 2015 for further details.
(3) Comparative information revised as a result of a re-classification of certain investments in prior periods. Please see Note 22 to the financial statements for the quarter ended 31 March 2016 for further details.
COMMENTARY ON STATEMENT OF OPERATIONS FOR THE QUARTER ENDED 31 MARCH 2016 COMPARED WITH THE QUARTER ENDED 31 MARCH 2015
Net Income
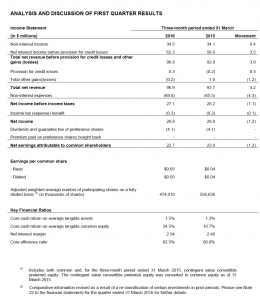
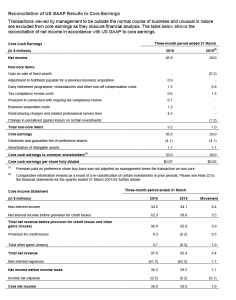
Core earnings for the quarter ended 31 March 2016 were $36.0 million, up $7.0 million from $29.0 million in 2015, an improvement of 24.1%. After including non-core items outside the course of normal business of ($9.2) million in the first quarter of 2016 and $1.0 million in 2015, total net income for the first quarter of
2016 was $26.8 million, a decrease of $1.2 million compared to first quarter 2015 net income of $28.0 million.
The $7.0 million core earnings increase is comprised of mainly of the following:
• A $3.5 million increase in net interest income, principally from higher interest earned on loans due to volume and rate increases in the Bermuda commercial loan portfolio, as well as a decrease in interest expense on deposits due to decreased rates across several jurisdictions;
• A $0.5 million reduction in provision for credit losses as a result of the sale of a property previously included in non-accrual loans in the UK jurisdiction, resulting in a large release out of provision for credit losses, which was slightly offset by slightly higher provisions recorded in Cayman and Bermuda;
• A $1.0 million increase in other gains (losses) as a result of gains booked for the first quarter of 2016 on the held-for-trading portfolio in the UK and Guernsey; and
• A $1.7 million dollar reduction in core non-interest expenses principally from lower core salary and benefit expense as a result of positive headcount variances in Guernsey and the UK as well as lower post-retirement healthcare and defined benefit pension costs due to changes in the discount rate used.
The net interest margin for the quarter increased by 0.06% to 2.54% in the first quarter of 2016 due primarily to higher yields on loans due to increased rates in certain portfolios as well as lower cost of deposits due to lower rates.
Net Interest Income before Provision for Credit Losses
Net interest income increased by $3.5 million to $62.3 million in the first quarter of 2016, compared to $58.8 million for the first quarter of 2015, due primarily to the following:
• Interest income increased by $1.8 million due to a $1.4 million increase in loan interest income on higher rates across several jurisdictions and volumes in the Bermuda commercial loan portfolio, along with a smaller increase of $0.5 million in investment interest income due to an increase in average volume of investments held, slightly offset by a $0.1 million decrease in interest earned on deposits with banks due to a decrease in term deposits placed;
• Interest expense decreased by $1.7 million resulting from a $1.5 million decrease in interest expense on deposits due to lower rates in several jurisdictions, and lower volumes of interest earning term deposits, as well as a $0.3 million decrease in interest paid on long-term debt due to one tranche of long-term debt rolling over into a lower interest rate during the third quarter of 2015.
Non-Interest Income
Total non-interest income improved from $34.1 million in the first quarter of 2015 to $34.5 million. The increase is attributed to:
• Banking services fees increased $0.4 million due to a revised fee schedule in Bermuda;
• Foreign exchange revenue increased by $0.4 million due to an increase in the volume of transactions;
• Trust services revenue increased $0.2 million due primarily to certain large fees received in the first quarter of 2016;
• Custody and other administrative fee revenue decreased $0.2 million due to volume decreases;
• Asset management fees decreased $0.1 million due to decreased assets managed in the Butterfield Money Market Funds; and
• Other non-interest income decreased $0.3 million due primarily to decreases in rental income resulting from the sale of a building in the fourth quarter of 2015.
Provision for Credit Losses
The Bank’s net provision for credit losses in the first quarter of 2016 was a recovery $0.3 million compared to an expense of $0.2 million in 2015. During the first quarter of 2016, we realised a net recovery due to a release of approximately $0.7 million due to a recovery on a non-accrual loan in the UK and charge-offs in other jurisdictions, which was offset by $0.3 million of incremental reserves related to movements in general provisions. This compares to the first quarter of 2015 when the Bank required incremental provisions relating to specific reserves of $0.7 million that were partially offset by recoveries of $0.5 million.
Other Gains (Losses)
Core gains of $0.7 million in the first quarter of 2016 were up $1.0 million from $0.3 million of losses in the first quarter of 2015 due primarily to favourable movements of $0.7 million on the valuation of the held-for-trading portfolio in Guernsey, as well as a relative increase caused by a $0.4 million loss incurred in the first quarter of 2015 on the sale of an available-for-sale security.
Operating Expenses
Core non-interest operating expenses increased by $1.7 million from $63.2 million in the first quarter of 2015 to $61.5 million in 2016.
Core salaries and benefits costs were $29.6 million in first quarter of 2016, down $2.2 million from a decrease in post-retirement medical expenses and defined benefit pension plans resulting from discount rate revisions, as well as a decrease in overall salaries due to a decrease in headcount in two jurisdictions. Headcount on a full-time equivalency basis at quarter-end was 1,114, down 26 compared to 1,140 a year ago.
Other notable core operating expense variances include:
• Property expenses decreased by $0.1 million due to lower electricity costs and lower property maintenance costs;
• Professional and outside services costs increased by $0.3 million due to increased legal fees; and
• Indirect taxes increased by $0.4 million due to an increase in VAT payable in the UK.
Non-core expenses increased by $8.2 million in the first quarter of 2016 from $1.0 million to $9.2 million due to:
• One-off compensation expenses amounting to $1.3 million;
• Restructuring charges relating to the announcement to commence an orderly wind down of the deposit taking and investment management businesses of Butterfield Bank (UK) Limited, and related professional services fees of $4.5 million;
• Expenses associated with an internal review and account remediation programme of US person account holders for potential violations of US laws regarding non-compliance with US tax law obligations amounting to $0.6 million;
• An additional provision of $0.7 million in connection with the aforementioned review and remediation programme, bringing the total provision to $5.5 million;
• An adjustment to the holdback and earn-out payable of $0.9 million from the Legis acquisition in 2014; and,
• Business acquisition expenses of $1.2 million related to the announced acquisition in Bermuda of HSBC’s Private Banking Trust and Investment Management business.
BALANCE SHEET COMMENTARY AT 31 MARCH 2016 COMPARED WITH 31 DECEMBER 2015
Total Assets
Total assets of the Bank were $10.2 billion at 31 March 2016, down $0.1 billion from 31 December 2015. The Bank maintained a highly liquid position at 31 March 2016 with $5.2 billion of cash and demand deposits with banks plus short and long-term investments, excluding held-to-maturity investments, representing 50.6% of total assets, compared with 50.8% at 31 December 2015.
Loans Receivable
The loan portfolio totalled $4.0 billion at the end of the quarter, flat from year-end 2015. The movement, due primarily to growth in the consumer non-mortgage lending in Bermuda and Cayman, growth in sovereign and public sector lending in the Bermuda portfolio offset by pay downs in commercial lending. As at 31 March 2016, gross loans written totalled $101.9 million, offset by net pay downs of $142.5 million.
Allowance for credit losses at 31 March 2016 totalled $46.5 million, a decrease of $2.8 million from year- end 2015. The movement was due mainly to a recovery in the UK as well as several smaller charge-offs on residential mortgages in Bermuda and Cayman.
The loan portfolio represented 38.8% of total assets at 31 March 2016 (31 December 2015: 38.9%), whilst loans as a percentage of customer deposits increased from 43.6% at year-end 2015 to 44.2% at quarter-end.
As at 31 March 2016, the Bank had gross non-accrual loans of $62.4 million, representing 1.2% of total gross loans, a decrease from the $65.3 million, or 1.6%, of total loans at year-end 2015. The decrease reflects the Bank’s maintenance and steady reduction in the level of non-accrual loans at year-end whilst working closely with clients prior to having difficulty servicing their debts. Net non-accrual loans were $45.7 million, equivalent to 1.2% of net loans, after specific provisions of $16.7 million, resulting in a specific provision coverage ratio of 26.8% compared to 29.3% at 31 December 2015.
Non-performing loans, which include gross non-accrual loans and accruing loans past due by 90 days or more, totalled $77.7 million as at 31 March 2016, down from $79.5 million at year-end 2015. This is a result of maintaining the non-performing portfolio at existing levels by continued, proactive engagement with our clients.
Investment in Securities
The investment portfolio was $3.7 billion at 31 March 2016, compared to $3.2 billion at 31 December 2015. The increased portfolio size was funded through the use of cash due from banks, which were used to purchase liquid US government and federal agency securities, as well as highly rated corporate fixed
income securities and prime rated mortgage-backed securities. Additionally, approximately $80 million of trading securities were sold during the quarter, with the proceeds used to acquire US government and federal agency fixed income securities and mortgage-backed securities within the available-for-sale portfolio. This restructure was undertaken to reflect the growth in deposits and align the portfolio with market peers.
This resulted in the fair value of US government and federal agency securities held for trading decreasing by $68.1 million, and the US government and federal agency securities available-for-sale increasing by $347.3 million, with a further increase of $127.2 million to prime rated mortgage-backed securities.
The investment portfolio was made up of high quality assets with 92.4% invested in A-or-better-rated securities. The investment yield decreased year over year by 9 basis points to 2.07% at 31 March 2016. Total net unrealised gains were $20.4 million, compared to an unrealised gain of $0.5 million at year-end
2015. The increase in unrealised gains is largely attributable to a decrease in long-term treasury rates in the months which followed the US Federal Reserve decision to raise benchmark rates in late 2015.
Deposits
Average customer deposits increased by $0.1 billion to $9.1 billion in the first quarter of 2016 from $9.0 billion during the fourth quarter of 2015. On a quarter-end basis, customer deposits decreased $0.3 billion to $8.9 billion from $9.2 billion at year-end 2015.
REVIEW OF RESULTS OF MAJOR OPERATIONS Bermuda (Including Group Head Office)
Net income before gains and losses was $17.1 million at 31 March 2016, up $2.2 million from $14.9 million in the prior year, due to increased loan interest income and lower staff salaries and other employee benefits costs, partially offset by higher provisions for credit losses. Net other losses of $0.2 million during the first quarter of 2016 were in line with $0.2 million during the first quarter of 2015. Net income after gains and losses was $16.9 million, an increase of $2.2 million from $14.7 million in the first quarter of 2015.
Net interest income before provision for credit losses increased by $3.2 million to $38.8 million in the first quarter of 2016, due to higher loan interest from a combination of rate and volume increases, in addition to higher interest earned on deposits placed with other financial institutions, lower interest expense paid on customer deposits and lower interest expense on long-term debt, all primarily volume-driven with the exception of long-term debt, which was as a result of a move from fixed rate to floating rate in the third quarter of 2015.
Provision for credit losses was $0.4 million in the first quarter of 2016, down $0.6 million from the first quarter of 2015 when provision for credit losses was a recovery of $0.2 million.
Non-interest income decreased $0.6 million to $14.2 million for the first quarter of 2016 due to lower foreign exchange revenue due to decreased volume, lower rental income resulting from the sale of a building in the fourth quarter of 2015 and decreases in other sundry income.
Operating expenses decreased by $0.1 million to $35.6 million in the first quarter of 2016, due to lower staff salaries and other employee benefits costs, as well as the release of certain legal accruals, which is offset by increased technology and communications expense due to expenses in preparation for the onboarding of the announced acquisition of HSBC’s Private Banking Trust and Investment Management business, which is due to close by the 2016 year end. In addition, an additional provision associated with the aforementioned internal review and account remediation programme of US person account holders was recorded during the quarter.
Total assets as at 31 March 2016 were $5.2 billion, up $0.1 billion from year-end 2015. Customer deposits ended the period at $4.3 billion, flat from year-end 2015. Customer loan balances ended the period at $2.4 billion, up $0.2 billion from year-end 2015 due to volume increases primarily in the corporate and government loan portfolio.
Client assets under administration for the trust and custody businesses were stable at $31.9 billion and $29.2 billion, respectively, whilst assets under management were $2.1 billion. This compares with $32.1 billion, $29.4 billion and $2.1 billion, respectively, at 31 December 2015.
Cayman Islands
Quarterly net income before gains and losses was $14.1 million at 31 March 2016, up $1.8 million from $12.3 million in the prior year. Net income growth was due primarily to increases in interest income on investments and loans and non-interest income led by volume-driven foreign exchange income, banking, asset management and trust fees, partially offset by increased salary and other employee benefits and
technology sourcing costs.
Net interest income before provision for credit losses was $18.8 million in the first quarter of 2016, an improvement of $2.1 million compared to the first quarter of 2015. The increase was driven primarily by an improvement in investment income which was up $1.1 million resulting from an average increase of $341.8 million in floating-rate notes while average fixed-rate securities declined by $7.1 million. Loan income was up $0.8 million as average loan balances increased by $48.7 million from 2015, attributable largely to growth in residential mortgages and the increase in Cayman’s base lending rate in December of 2015. Average customer deposits increased by $401.6 million over the first quarter of 2015 while deposit liability costs declined by $0.1 million.
Provision for credit losses of $0.2 million was up $0.5 million from the first quarter of 2015 when provision for credit losses was a recovery of $0.3 million.
Non-interest income was $10.7 million, up $1.1 million from the first quarter of 2015. The increase was due primarily to volume-driven growth in foreign exchange, banking fees and commissions driven by account transaction service wire transfer fees, along with asset management and trust fees.
Operating expenses increased $1.0 million to $15.2 million in the first quarter of 2016, driven primarily by organisational restructuring and early retirement costs along with increased technology and communications costs.
Total assets at 31 March 2016 were $3.4 billion, up $0.1 billion from year-end 2015, reflecting higher client deposit levels which rose $0.1 billion to $3.1 billion at 31 March 2016. Net loans of $1.2 billion were up $0.1 billion from year-end 2015 levels following the participation in additional UK based residential mortgages. The available-for-sale investments of $1.3 billion were up $0.3 billion from year-end 2015 resulting from a greater allocation to interest earning assets.
Client assets under administration for the trust and custody businesses were $3.5 billion and $2.3 billion, respectively, whilst assets under management were $0.9 billion at 31 March 2016. This compares with $3.5 billion, $2.0 billion and $0.9 billion, respectively at 31 December 2015.
Guernsey
Guernsey posted net income before gains and losses of $1.0 million in the first quarter of 2016, flat from the first quarter of 2015. This amount remained flat quarter over quarter, due primarily to lower net interest income from lower loan revenues and adverse foreign exchange variances being offset by lower non-interest expenses from lower salary-related expenses and favourable exchange rate variances.
During the first quarter of 2016, there was a revision to the accrual for the holdback and earn-out payable for the 2014 acquisition of Legis in the amount of $0.9 million due to strong revenue exhibited from legacy Legis clients.
Net interest income before provisions for credit losses declined by $0.4 million to $3.7 million in the first quarter of 2016, compared to $4.1 million in the first quarter of 2015, attributable to lower loan interest from declining loan balances, weakening investment yields and adverse exchange rates offset by lower interest expense from lower deposit balances and rate management
Provision for credit losses was nil at 31 March 2016 and for the 2015 year-end.
Non-interest income increased $0.1 million to $6.5 million in the first quarter of 2016 from higher trust and foreign exchange revenues offset by adverse exchange rate variances.
Operating expenses at $9.1 million were $0.4 million lower than 2015 due primarily to favourable exchange rate variances, and lower salary-related expenses.
Total assets of $1.4 billion as at 31 March 2016 were unchanged from year-end 2015. Customer deposits ended the period at $1.2 billion, flat from year-end 2015. Customer loan balances ended the period at $0.4 billion, flat from year-end 2015.
Client assets under administration for the trust and custody business were $31.2 billion and $6.4 billion, respectively, whilst assets under management were $0.4 billion at 31 March 2016. This compares with $31.3 billion, $6.3 billion and $0.4 billion, respectively, at 31 December 2015.
United Kingdom
The UK recorded a net loss before gains and losses of $5.2 million in the first quarter of 2016, down $4.0 million from a net loss before gains and losses of $1.2 million in the first quarter of 2015. The majority of the decrease is due to costs associated with the orderly wind-down of the deposit taking and asset management businesses, which totalled $4.5 million during the first quarter of 2016, as well as lower net interest income due to lower loan balances.
Net other gains of $1.2 million during the first quarter of 2016 were favourable by $0.3 million, compared to $0.9 million in the first quarter of 2015, due primarily to one-off gains on the transfer of debt securities to other group jurisdictions. Net loss after gains and losses was $4.0 million, a decrease of $3.7 million from a net loss of $0.3 million in the first quarter of 2015.
Net interest income before provision for credit losses of $1.0 million was down $1.4 million from $2.4 million in the first quarter of 2015. The decrease was due primarily to reduced loan interest income, which resulted from the Cayman and Bermuda jurisdictions’ sub-participation in $381 million of the UK’s net loans. The purpose of the sub-participation was to provide funding for the repayment of depositors.
Provision for credit losses was a recovery of $1.0 million in the first quarter of 2016 compared to $0.6 million loss in the first quarter of 2015. Of this recovery figure, $0.7 million was due to a reduction in the general loan allowance, following the participation by Bermuda and Cayman. The other $0.3 million recovery followed a revaluation of property securing a non-accrual loan facility.
Operating expenses at $8.7 million in the first quarter of 2016 were $4.0 million higher than in the first quarter of 2015 due primarily to the aforementioned restructuring expenses and an increase in indirect taxes, slightly offset by lower salaries due to a lower headcount resulting from the orderly wind down.
During the first quarter of 2016, the UK repaid $0.3 billion of deposits to customers, with $0.3 billion of deposits yet to be repaid. These deposits will be repaid in an orderly fashion during the second quarter of
2016.
Custody client assets under administration at the end of the first quarter of 2016 amounted to $1.5 billion, down from $1.6 billion at 31 December 2015. Assets under management were $187 million at 31 March
2016, down from $209 million at 31 December 2015.
Notes:
Certain statements in this Release may be deemed to include “forward-looking statements” and are based on management’s current expectations and are subject to uncertainty and changes in circumstances. Actual results may differ materially from those included in these statements due to a variety of factors including worldwide economic conditions, success in business retention and obtaining new business and other factors.
This Release does not constitute an offer to sell securities, or a solicitation of an offer to buy securities, in any jurisdiction, including without limitation the United States of America. Securities may not be offered or sold in the United States of America absent registration or an exemption from registration under the U.S. Securities Act of 1933, as amended. A public offering of securities in the United States, if any such offering is made, will be made by means of a prospectus that may be obtained from The Bank of N.T. Butterfield & Son Limited ( “Butterfield”) containing detailed information about Butterfield and management, as well as financial statements.
Butterfield is specialist provider of international financial services. The Butterfield Group offers a full range of community banking services in Bermuda, and the Cayman Islands, encompassing retail and corporate banking and treasury activities. The Group variously provides private banking, asset management, investment advisory, residential property lending and personal trust services from its headquarters in Bermuda and subsidiary offices in The Bahamas, the Cayman Islands, Guernsey, Switzerland and the United Kingdom. Butterfield also provides services to corporate and institutional clients from offices in Bermuda, The Bahamas, the Cayman Islands and Guernsey, which include asset management and trust services.
Butterfield is publicly traded in Bermuda, and its shares are listed on the Bermuda Stock Exchange. Butterfield’s share price is published daily in The Royal Gazette (www.theroyalgazette.com) and is also available on Bloomberg Financial Markets (symbol: NTB BH) and the Bermuda Stock Exchange website (www.bsx.com). Further details on the Butterfield Group can be obtained from our website at: www.butterfieldgroup.com.