54 shocking sleep statistics and trends for 2019

From The Sleep Advisor see: https://www.sleepadvisor.org/sleep-statistics/
One sleepless night, nothing to worry about, they said.
This is what many Americans and people around the world say right before they are in a car crash or make a fatal mistake at work.

We all know that sleep is necessary for our physical and mental health, but very few know how important it really is.
The truth is that we take sleep for granted.
Sleep deprivation is similar to alcohol intoxication, and it may be helpful to think of it that way.
So, would you go to work intoxicated by alcohol? You certainly would not.
In just 10 minutes, these 54 sleep statistics will make it clear to you that sleeping disorders and deprivation are NO JOKE, and we should all take our sleep more seriously.
Who knows, knowing all this might save your or someone’s life.
Section 1
General Sleep Data and Statistics
Section 2
Sleep Deprivation Statistics
Section 3
Sleep Disorders Statistics
Section 4
Sleep Aids Statistics
01
General Sleep Data and Stats
Sleeping 60 to 90 minutes more per night can make you happier and healthier.
[1] American Psyhology Association
We dream 4-6 timesper night but forget 95-99% of our dreams the next morning.
REM Sleep constitutes of 20% of our total sleep time while the remaining 80% are non-REM sleep stages.
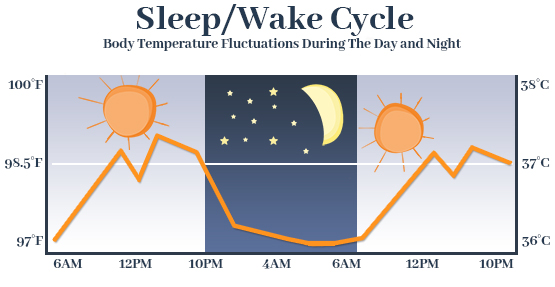
Our body temperature drops by 1-2 degrees during the night so it’s perfectly normal to feel a bit chilly.
41% of adults prefer to sleep in the fetal position while only 8% sleep on their back, even though it’s the healthiest position.
6-8% of the participants in one study reported a condition called “sexsomia” which means waking up in the middle of the night to get intimate with your partner.
[5] MDPI – Journal of Clinical Medicine
02
Sleep Deprivation Statistics
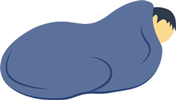
In 1942, Americans had 7.9 hours on average hours per night compared to 6.8 hours in 2013, which is a 13% decrease.
40% of people age 40 to 59 reported that they are getting less than recommended amounts of sleep.
[7] National Center for Biotechnology Information
Falling asleep takes on average10-15 minutes. If you pass out within a few minutes, it might mean you are sleep deprived.
Lack of Sleep costs the United States over $411 BillionAnnually, reported Fortune Magazine.
35% of adults don’t get enough sleep (7 hours per day) according to the CDC.
[8] Centers for Disease Control and Prevention
20% of teenagers get less than5 hours of sleep, while average amount is 6.5 hours.
REM Sleep constitutes of 20%of our total sleep time while the remaining 80% are non-REM sleep stages.
Over 100 thousand deaths can be attributed to medical errors due to sleep deprivation.
[10] National Center for Biotechnology Information
People with a college degree or higher have the most sleep (72%), while unemployed or those unable to work much lower (at 51 and 60% respectively).
[8] Centers for Disease Control and Prevention
Healthy Sleep duration is more common among married people (67%), and lower in those who were never married (62%) or who were divorced, separated, or widowed (56%).
[8] Centers for Disease Control and Prevention
37% of people between 20 and 39 years-old reported short sleep duration.
[7] National Center For Biotechnology Information
The population of Hawaii has the shortest sleep duration (54%) while South Dakota has the highest (72%).
[8] Centers for Disease Control and Prevention
Almost 20% of all car crash accidents and injuries are associated with sleepiness.
[11] National Center for Biotechnology Information

3-5% of obesity in adults could be caused by lack of sleep.
[12] Harvard | School of Public Health
03
Sleep Disorders Statistics
50 to 70 million people in the US suffer from one or several sleep disorders.
[14] Maternal and Child Health Burea
48% of people in the U.S. reported snoring problems.
[15] Centers for Disease Control and Prevention
4.7% reported falling asleep or nodding off while driving in the preceding month.
37.9% of people reported unintentionally falling asleep during the day or at work in the last 30 days.
Insomnia

30% of adult U.S. population suffer from Insomnia and 10% from chronic Insomnia, making it the most common sleep disorder.
[18] National Center for Biotechnology Information
75 to 90% of insomnia sufferers have an increased risk of medical disorders such as hypoxemia, GSD, and pain conditions.
[19] National Center for Biotechnology Information
40% of all insomnia patients have a coexisting psychiatric condition.
[20] National Center for Biotechnology Information
Sleep Apnea
25 Million U.S. adults suffer from obstructive sleep apnea.
4-9% of middle-aged men and2-4% of women suffer from sleep apnea.
24-31% of men and 9-21% of women have obstructive sleep apnea, making it more prevalent in men.
An estimated 10 million people in the United States remain undiagnosed.
[22] National Center for Biotechnology Information
Over 50% of diagnosed sleep apnea cases are reported in people age of 40 and over.
[23] National Center for Biotechnology Information
Narcolepsy

One in 500 people that carry a gene responsible for developing narcolepsy will actually develop the disorder.
[24] National Organization for Rare Disorders
Only 20-25% of people will have all four narcolepsy symptoms (daytime sleepiness, sudden loss of muscle function, sleep paralysis, and hallucinations).
[25] National Institute of Neurological Disorders and Stroke
Narcolepsy affects 1 in every 2000 people in the States and over 3 millionworldwide.
Over 60% of Narcolepsy patients were misdiagnosed as obstructive sleep apnea or depression.
[27] National Center for Biotechnology Information
It is estimated that 75% of people suffering from Narcolepsy remain undiagnosed.
[25] National Institute of Neurological Disorders and Stroke
135,000 to 200,000 people in the United States have narcolepsy and affects men and women equally.
[25] National Institute of Neurological Disorders and Stroke
04
Sleep Aids Statistics
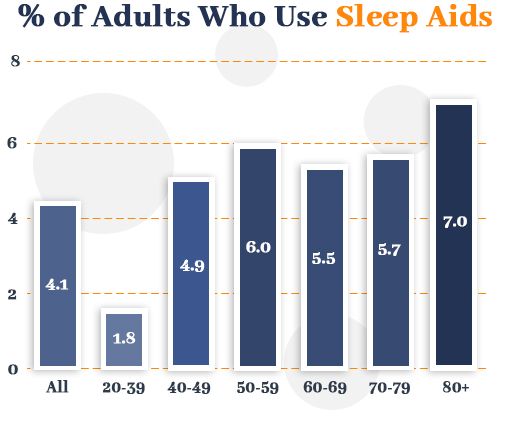
Over 4% of U.S. adults (age 20 and over) said they took some sort of medications or sleep aids in the last 30 days.
[28] Centers for Disease Control and Prevention
Over 16% of adults using some form of sleep aids have reported a physician’s diagnosis of a sleep disorder, which is 5 times higher than in those who did not report such diagnosis.
[28] Centers for Disease Control and Prevention
9 Million Americans take prescription drugs to help them fall asleep.
There are over 4700 sleep centers and labs in the U.S.
Sleep medication use was higher among women (5%) compared to men (3.1%).
[28] Center for Disease Control and Prevention
The frequency of sleep med use is associated with higher mortality rate.
[31] National Center for Biotechnology Information

China is the most “sleep medicated” country in the world.
Those using sleep pills have a35% higher chance of developing cancer, according to BMJ.
CPAP devices market is valued at $4.3 billion and growing7.2% a year.
05
Technology and Sleep
Over 10% of surveyed adults said they use sleep trackersregularly, 12% said they use it occasionally, while 30% said they won’t use it.
50% more women use sleep trackers regularly compared to men.
15% of the regular sleep app users are less than 30 years old and 9% are over 45 years old.
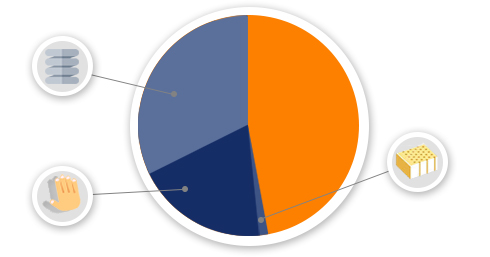
Spring mattresses are still the most popular (32%) followed bymemory foam mattresses (22%) while latex beds are at only 2%.
Smart Mattress market size annual growth is 8.51% and was worth$92 million in 2017.
North America constitutes54% of Sleep Tracking device market share of the $1,121.5 Million USD of the total market.
8% of the U.S. adults use mobile apps to track sleep regularly and 9% occasionally while 31% declared they won’t use.
Sources and References:Follow Us on Social Media Info and Legal
About Us
Sleep Advisor was created out of frustration. We asked our friends about how they find information about sleep information and products. Most of them kept saying they go online and read what shows up on Google. After hearing that, we decided to try it out for ourselves. We conducted search after search and realized there was a common issue: The information wasn’t up to our standards.
Read More > Copyright © 2019, Sleep Advisor. All rights reserved.
SOURCE: https://www.sleepadvisor.org/sleep-statistics/
Al;so see: https://trendytarzan.com/