Butterfield reports second quarter 2022 results

Financial highlights for the second quarter of 2022:
- Net income of $49.1 million, or $0.99 per share, and core net income1 of $50.2 million, or $1.01 per share
- Return on average common equity of 24.5% and core return on average tangible common equity1 of 27.8%
- Net interest margin of 2.26%, cost of deposits of 0.16%
- Board declares dividend for the quarter ended June 30, 2022 of $0.44 per share
Hamilton, Bermuda – July 25, 2022: The Bank of N.T. Butterfield & Son Limited (“Butterfield” or the “Bank”) (BSX: NTB.BH; NYSE: NTB) today announced financial results for the second quarter ended June 30, 2022.
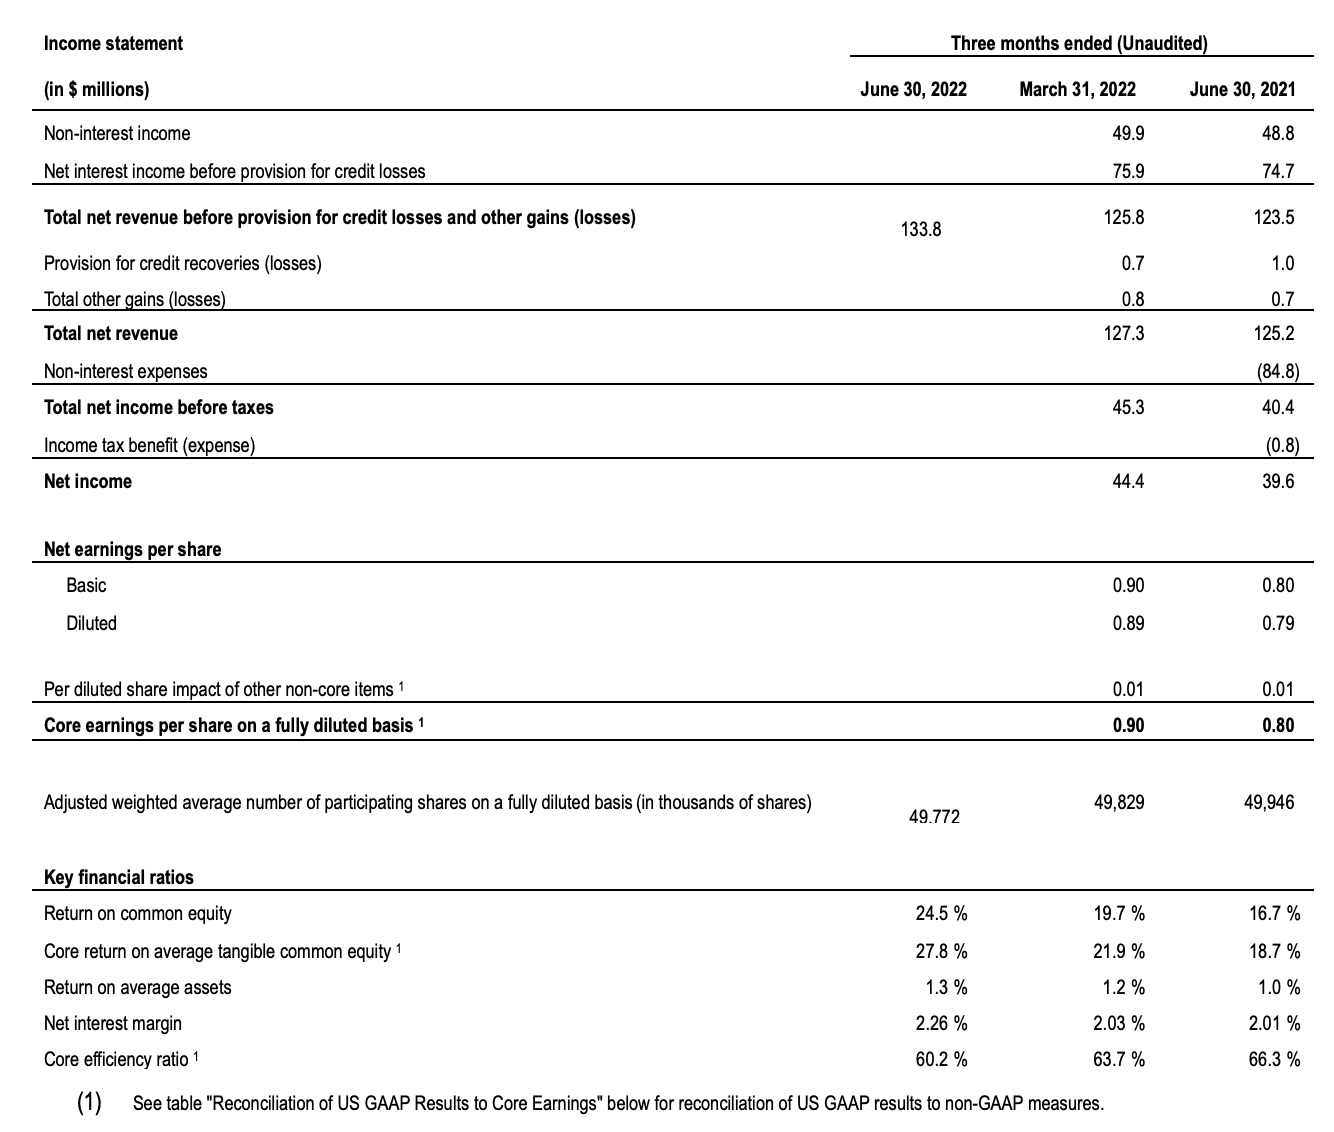
Net income for the second quarter of 2022 was $49.1 million or $0.99 per diluted common share compared to net income of $44.4 million, or $0.89 per diluted common share, for the previous quarter and $39.6 million, or $0.79 per diluted common share, for the second quarter of 2021. Core net income1 for the second quarter of 2022 was $50.2 million, or $1.01 per diluted common share, compared to $44.7 million, or $0.90 per diluted common share, for the previous quarter and $40.1 million, or $0.80 per diluted common share, for the second quarter of 2021.
The core return on average tangible common equity1 for the second quarter of 2022 was 27.8%, compared to 21.9% for the previous quarter and 18.7% for the second quarter of 2021. The core efficiency ratio1 for the second quarter of 2022 was 60.2% compared with 63.7% in the previous quarter and 66.3% for the second quarter of 2021.
Michael Collins, Butterfield’s Chairman and Chief Executive Officer, commented, “Butterfield was able to build on our first quarter momentum with continued strong results in the second quarter of 2022. Revenue generation was robust, with growth in both interest and non-interest income. As anticipated, non-core commercial deposits have moderated due to client investment of cash and the strong US dollar impact on foreign currency deposits. As overall deposit levels normalize further, we expect the Bank to return to an organic deposit growth rate of low single digit percentages annually. Our net interest margin increased 23 basis points and should continue to improve in the rising rate environment.
“I am also pleased to share that Butterfield has recently joined the United Nations Global Compact (“UNGC”) – the world’s largest corporate sustainability initiative. Participating in the UNGC reinforces our commitment to ethical and responsible business practices and gives us an organizing framework as we continue to develop our environmental and social responsibility programs, aimed at creating shared value for the communities in which we operate.”
(1) See table “Reconciliation of US GAAP Results to Core Earnings” below for reconciliation of US GAAP results to non-GAAP measures.
Net interest income (“NII”) for the second quarter of 2022 was $82.0 million, an increase of $6.1 million, compared with NII of $75.9 million in the previous quarter and up $7.3 million from $74.7 million in the second quarter of 2021. NII was higher during the second quarter of 2022 compared to the prior quarter primarily due to higher yields on treasury securities, loans and investments, which was slightly moderated by higher deposit costs, particularly in the Channel Islands. Compared to the second quarter of 2021, NII was higher due to increased asset yields, which were partially offset by lower average interest earnings asset volume.
Net interest margin (“NIM”) for the second quarter of 2022 was 2.26%, an increase of 23 basis points from 2.03% in the previous quarter and up 25 basis points from 2.01% in the second quarter of 2021. NIM in the second quarter of 2022 was higher than the prior quarter and second quarter of 2021 primarily due to improved market interest rates and a favorable mix of deployment into higher yielding assets.
Non-interest income for the second quarter of 2022 of $51.8 million was $1.9 million higher than the $49.9 million earned in the previous quarter and $3.0 million higher than $48.8 million in the second quarter of 2021. Non-interest income during the second quarter of 2022 increased compared to the prior quarter primarily due to increased Trust revenue from the onboarding of new clients and activity-based revenues, and other non-interest income, consisting of the scheduled recognition of unclaimed assets. Non-interest income was up in the second quarter of 2022 compared to the second quarter of 2021 due to the increased unclaimed assets and increased foreign exchange commissions.
There was a provision for credit losses of $0.7 million for the second quarter of 2022, compared to a net credit recovery in the previous quarter of $0.7 million and a net credit recovery of $1.0 million during the second quarter of 2021. The increase in the provision for credit losses was driven by loan originations and less favorable macroeconomic forecasts.
Non-interest expenses were $83.0 million in the second quarter of 2022, compared to $82.0 million in the previous quarter and $84.8 million in the second quarter of 2021. Core non-interest expenses1 increased to $81.9 million in the second quarter of 2022, compared to $81.6 million the previous quarter and lower than the $83.4 million incurred in the second quarter of 2021. Core non-interest expenses1 were relatively consistent in the second quarter of 2022 versus the previous quarter. Compared to the second quarter of 2021, non-interest expenses were lower due to a one-time program in the prior period that allowed employees to receive payment for unused vacation time during the pandemic, which was not repeated in the current quarter.
Period end deposit balances were lower at $13.1 billion, compared to December 31, 2021 at $13.9 billion due to the anticipated normalization of pandemic-related elevated deposit levels, as well as the impact of foreign exchange translation from non-US dollar deposits following the strengthening of the US dollar. Deposits continued to remain elevated across all jurisdictions.
The Bank maintained its balanced capital return policy. The Board again declared a quarterly dividend of $0.44 per common share to be paid on August 22, 2022 to shareholders of record on August 8, 2022.
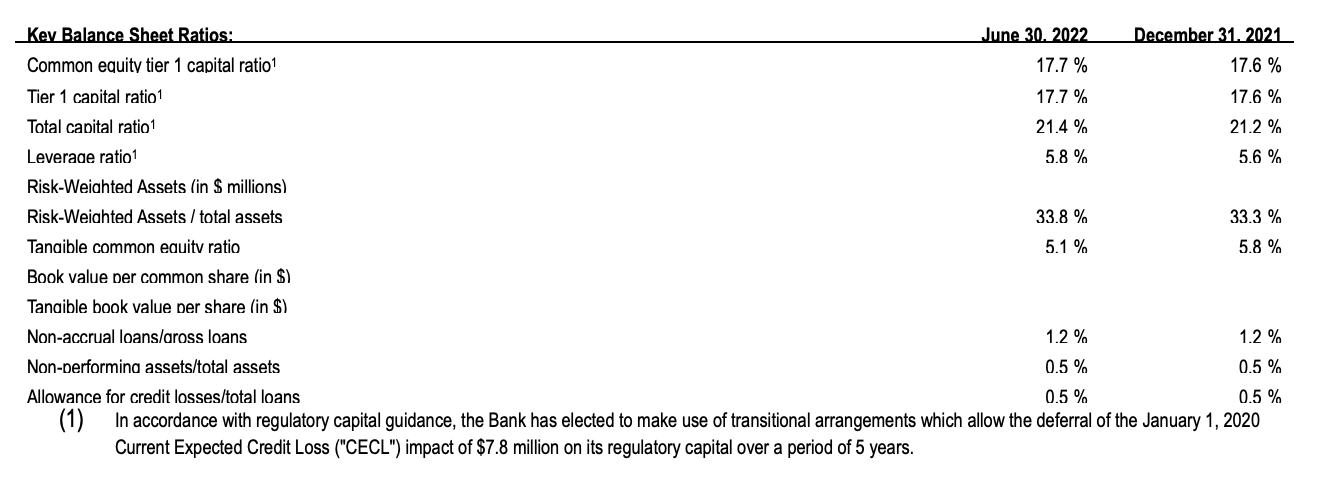
The current total regulatory capital ratio as at June 30, 2022 was 21.4% as calculated under Basel III, compared to 21.2% as at December 31, 2021. Both of these ratios remain significantly above the minimum Basel III regulatory requirements applicable to the Bank.
ANALYSIS AND DISCUSSION OF SECOND QUARTER RESULTS
QUARTER ENDED JUNE 30, 2022 COMPARED WITH THE QUARTER ENDED MARCH 31, 2022
Net Income
Net income for the quarter ended June 30, 2022 was $49.1 million, up $4.8 million from $44.4 million in the prior quarter.
The $4.8 million increase in net income in the quarter ended June 30, 2022 compared to the previous quarter was due principally to the following:
- $6.1 million increase in net interest income before provision for credit losses, driven by the impact of higher market interest rates across the yield curve, which was partially offset by higher deposit costs, predominantly in the Channel Islands;
- $1.9 million increase in non-interest income due to an increase in long-held unclaimed customer check and draft balances being recognized in revenue;
- $1.4 million increase in provision for credit losses driven by the extension of a large, long-term government facility in the Cayman Islands as well as a lower incremental improvement in macroeconomic forecasts impacting future expected credit loss estimates; and
- $1.3 million increase in salaries and other employee benefits primarily due to costs associated with the departure of a senior executive and recorded as a non-core item.
Non-Core Items1
Non-core items resulted in a net expense of $1.1 million in the second quarter of 2022. Non-core items for the quarter mainly relate to the costs associated with the departure of a senior executive.
Management does not believe that comparative period expenses, gains or losses identified as non-core are indicative of the results of operations of the Bank in the ordinary course of business.
- See table “Reconciliation of US GAAP Results to Core Earnings” below for reconciliation of US GAAP results to non-GAAP measures.
BALANCE SHEET COMMENTARY AT JUNE 30, 2022 COMPARED WITH DECEMBER 31, 2021
Total Assets
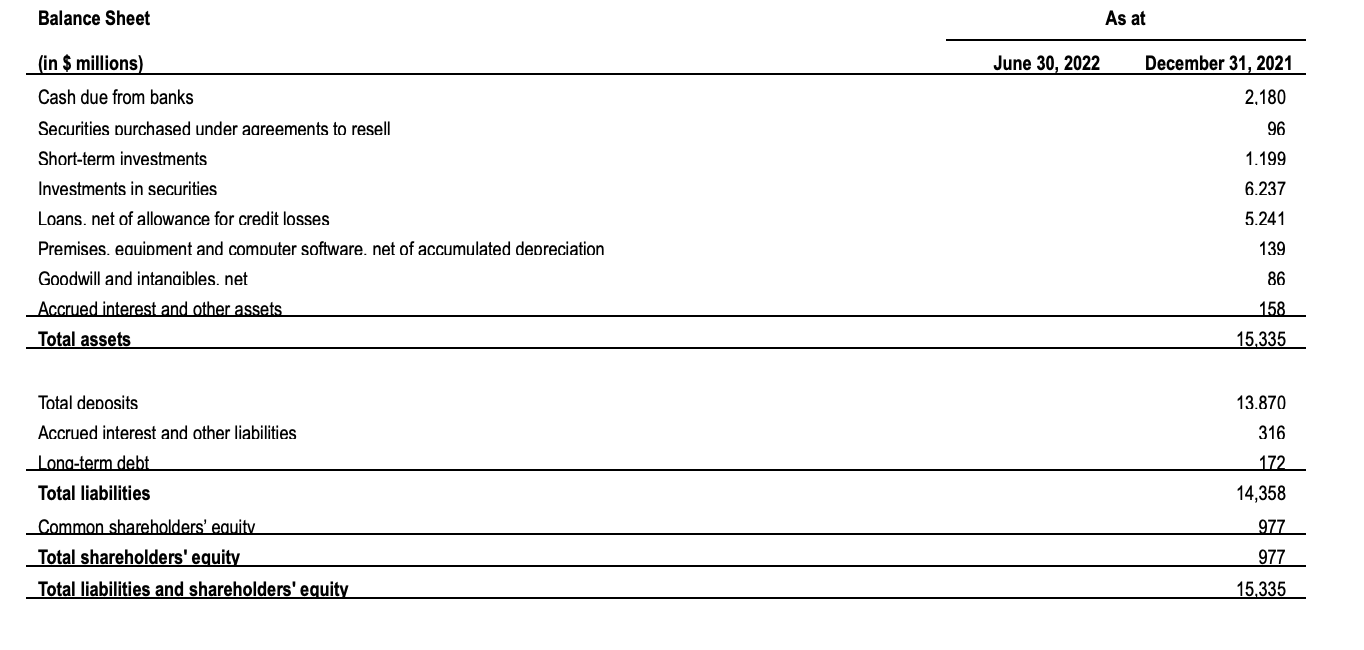
Total assets of the Bank were $14.3 billion at June 30, 2022, a decrease of $1.0 billion from December 31, 2021. The Bank maintained a highly liquid position at June 30, 2022, with its $8.8 billion of cash and demand deposits with banks, reverse repurchase agreements and liquid investments representing 61.5% of total assets, compared with 63.3% at December 31, 2021.
Loans Receivable
The loan portfolio totaled $5.1 billion at June 30, 2022, which was $0.1 billion lower than December 31, 2021 balances. The decrease was driven by the Channel Islands and UK segment as a result of facility repayments and a decrease in the GBP/USD foreign exchange rate and partially offset by the extension of a government facility in the Cayman Islands.
Allowance for credit losses at June 30, 2022 totaled $25.0 million, a decrease of $3.1 million from $28.1 million at December 31, 2021. The movement was driven by a decrease in non-accrual loans, net paydowns in the portfolio and the positive economic forecasts and partially offset by the extension of a large, long-term government facility in the Cayman Islands.
The loan portfolio represented 35.8% of total assets at June 30, 2022 (December 31, 2021: 34.2%), while loans as a percentage of total deposits increased to 39.3% at June 30, 2022 from 37.8% at December 31, 2021. The increase in both ratios were attributable principally to a decrease in deposit balances at June 30, 2022 driven by the expected withdrawal of some pandemic-related deposits as well as the impact of the strengthening US dollar on non-US dollar denominated balances.
As of June 30, 2022, the Bank had gross non-accrual loans of $62.2 million, representing 1.2% of total gross loans, an increase of $1.2 million from $61.0 million, or 1.2% of total loans, at December 31, 2021. The increase in non-accrual loans was driven by a few residential mortgages in the Channel Islands and UK segment moving into non-accrual and partially offset by a number of Bermuda residential mortgages improving to current status.
Other real estate owned (“OREO”) increased by $0.1 million from December 31, 2021 to $0.7 million due to the foreclosure of a loan in the Channel Islands and UK segment and which was partially offset by the sale of a property in Bermuda.
Investment in Securities
The investment portfolio was $6.0 billion at June 30, 2022, down $0.3 billion from $6.2 billion at December 31, 2021. The movement was driven by the increase in total net unrealized losses on the available-for-sale portfolio that is carried at fair value.
The investment portfolio is made up of high quality assets with 100% invested in A-or-better-rated securities. The investment book yield increased to 1.89% during the quarter ended June 30, 2022 from 1.79% during the previous quarter. Total net unrealized losses on the available-for-sale portfolio increased to $152.0 million, compared with total net unrealized losses of $21.8 million at December 31, 2021, as a result of rising long-term US dollar interest rates. No credit losses have been noted as at June 30, 2022.
Deposits
Average deposits were $13.6 billion for the quarter ended June 30, 2022, a decrease of $0.5 billion compared to the previous quarter, while period end balances as at June 30, 2022 were $13.1 billion, a decrease of $0.8 billion compared to December 31, 2021.