Cayman Islands Crime and Traffic Statistics Report 2017
 Crime and Traffic Statistics Report 2017 – Explanatory Notes and Commentary
There were 31,685 calls for service in 2017, 34,520 in 2016 and 33,474 in 2015. The graph compares the last three years by quarter. In 2017, calls for service decreased by 2,835 when compared to 2016. This is an 8% decrease.
1. Introduction
The RCIPS is presenting its year-end crime statistics for 2017 with slightly more detail than previous years. The objective of this more comprehensive reporting is to provide the public with more information on aspects of crime and enforcement that are of greater interest, while also representing the scale and scope of the Service’s work more completely. Ultimately, the goal of all crime reporting is to empower communities with meaningful and accurate information with which they can articulate their public safety priorities. As such, the presentation of RCIPS annual crime and traffic statistics will evolve as needed and in response to input from various sources, including the public. This document aims to provide a better understanding of crime trends in the Cayman Islands, and inform the best application of resources to address these.

Going forward, the RCIPS will publish crime statistics on an annual basis. The statistics will be provided within three months after the end of the year, to allow for outstanding reports and data to be fully collected and incorporated.
2. Scope of Policing Duties and Incidence of Crime
It is important to note that crime and traffic statistics reflect only a subset of the workload of the RCIPS. Officers proactively patrol and respond to a variety of incidents, including medical emergencies, search and rescue, suspicious activity reports, false alarms and others, the overwhelming majority of which are never recorded as a crime. Graph 1 provides a sense of the overall workload of RCIPS’ frontline policing, which includes Calls for Service dispatched by the 9-1-1 Communications Centre,1 but also non-emergency calls received by police stations.2
Graph 1: Overall RCIPS Calls for Service, 2015-2017 – NOT AVAILABLE
Incidence of Crime
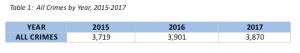
While there were 31,685 calls for service answered by police in 2017, there were 3,870 crimes recorded.
When comparing 2017 with 2016, the total number of all crimes (inclusive of drug enforcement) decreased slightly (by 31 offences), from 3,901 to 3,870.
Table 1: All Crimes by Year, 2015-2017 – See Attached
3. Data Collection and Interpretation
All crime and traffic statistics in this document should be interpreted taking the following as a basis:
A crime is defined as an illegal/reckless act or activity for which a person can be punished by law.
Statistical data in this document pertaining to crimes represent the substantiated principal crimes and offences that occurred in the 2017 calendar year. If an incident was included here, then evidence was gathered in the course of investigative actions (collection of witness statements, forensic examinations, etc.) that reasonably indicated, at the very least, that a crime had taken place. An incident was then considered substantiated, and the incident was “crimed” — meaning that it was added to the crime figures in the appropriate category.
When there was insufficient evidence to substantiate crimes alleged in a report, then the report remained unsubstantiated, and was not included in these crime figures. It remained an incident only.
Only primary offences are included in cumulative statistical data, as per UK National Counting Rules. This means that the primary offence for which they were arrested for would be recorded and any additional offences (secondary offences) that stems from that single incident will not be included in the cumulative statistics;
Crimes that occurred during the 2017 calendar year but were undisclosed or unknown to police would be reflected in these figures at a later date; therefore future slight variations in these numbers are possible.
To ensure the quality and integrity of its data, the RCIPS is engaging with the Economics and Statistics Office to formalize a crime counting protocol going forward with the objective of securing affirmation of our crime counting process.
4. 2017 Cumulative Crime Totals
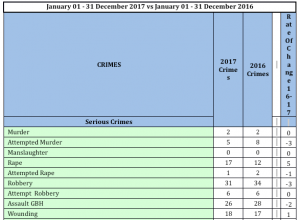
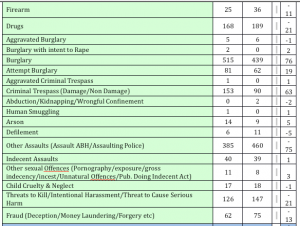
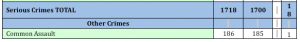
Figure 1 summarizes crime totals for the years 2017 vs. 2016.
The following notes explain certain changes in the presentation of the cumulative stats.
The Cumulative Statistics are grouped by “Serious” and “Other” Crimes, dispensing with earlier categories used such as “Volume” or “Violent” crime. These earlier terms carried distinctions that at times lacked clarity. Serious crimes can be defined as those that can carry significant custodial sentences, while those in the Other crimes category may carry no custodial sentence;
Firearm and Drug Incidents are now incorporated into general crime categories, but are broken down further and explained in greater detail in sections 7 & 8;
Child Cruelty and Neglect, as well as “Other sexual offences” pertaining to children have been included in their own categories to register organizational focus in this area;
Domestic Violence/Assault as a separate category has been removed, since crimes that arise from or are related to domestic violence can span across different crime categories. A better indicator of the incidence of domestic violence-related crime are referrals received and handled through the Family Support Unit, which are described under section 9;
A general Fraud category has been included to summarize deception offences;
Arson and Motor Vehicle Theft, which have increased in 2017 and have generated public interest, have been included in separate categories;
All crimes of significant public interest, such as violent crimes, burglaries, firearm and drug incidents, are broken down further and discussed further in sections 6 through 10.
Observations on Cumulative Statistics:
While the numbers of certain crimes have varied notably between 2016 and 2017 (e.g., burglaries, assault ABH), the overall cumulative incidence of crime across general categories has varied only slightly, as such: Serious Crimes (by 17, less than +1%), Other Crimes (by 106, about -5%), Overall (by 31, approximately -1%).
5. Overview: Serious and Other Crimes
Serious crimes account for 1718 (44%) of all crimes in the Cayman Islands, and many crimes within this category had no notable statistical fluctuation across 2016 and 2017. Those crimes are murder, attempted rape, robbery, attempted robbery, assault GBH, wounding and aggravated burglary.
Several other serious crimes did register notable decreases or increases, which can indicate emerging problems or crime trends. Those crimes which registered notable decreases in 2017 were attempted murder, firearm offences, drug offences, defilement, assault ABH, threatening offences, and fraud. The decreases in firearm and drug offences, of 31% (11) and 11% (21), respectively, are explored further under sections 7 & 8.
The following serious crimes registered notable increases in 2017, namely, rape, other sexual offences (pornography, gross indecency, incest) arson and burglary and burglary-related offences (burglary, attempted burglary and criminal trespass). Burglary is discussed at length in section 6, while the increase in sexual offence reporting as it relates to domestic violence and child protection issues is addressed in section 9.
Arson registered an increase in 2017 (5 incidents, or 56% increase), due to a series of vehicle arsons that occurred throughout the year. No one was injured in these incidents.
Overview: Other Crimes
Other Crimes account for 2117 (55%) of all crimes committed in the Cayman Islands in 2017. These statistics indicate notable increases in the number of reports of motor vehicle thefts,3 but a decrease in theft reports overall. Anti-social behavior reports decreased significantly, but were countered in part by an increase in disorder offences. Threatening offences (including Threats to Kill, Harassment) have gone down, but threatening or fraudulent behavior in the online environment (in violation of the ICT Law) increased steadily for the third year in a row.
There were fewer marine offences reported, but a marked increase in the number of animal offences. This increase can be attributed to a steady influx of ferocious dog/dog dangerously out of control reports received throughout the year, which often involved licensed animals as well as strays. Serious dog bite injuries were reported in some of these incidents, which also involved children.4
The RCIPS partners with other agencies, namely the DOE and DOA, as a secondary enforcer of the Animal and Marine Conservation Laws. It does, however, take a lead investigative role in animal incidents where people have been injured, while the DOA takes a lead role in animal cruelty complaints.
The RCIPS has joined efforts with DOA to raise awareness among dog-owners of their obligations, and furthering both public education and enforcement priorities within this partnership is a priority within the Community Policing Programme.
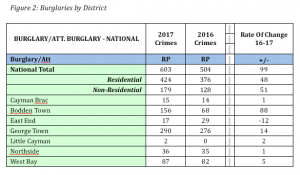
6. Burglary
The serious crime with the greatest number of victims in the Cayman Islands in 2017 is Burglary. In 2017 the total number of burglaries was 515, and the total number of other burglary-related offences was 242. Burglary and Attempted Burglary increased notably in 2017, by 76 (17%) and 19 (31%), respectively. Also of note was a steep increase in Criminal Trespass, by 63 (70%).
Burglaries affect all districts throughout the islands, and during certain periods in 2017, specific areas experienced marked increases in these offences. During the spring, for instance, a wave of burglaries affected Bodden Town, most of which fit a similar pattern and were found to have been committed by the same group of individuals.5 However, not all districts had similar experiences in 2017; burglaries decreased in East End and stayed about the same in North Side.
Figure 2 describes burglaries and burglary-related offences (burglary, attempted burglary, aggravated burglary and burglary with intent to rape) across all districts, and also provides a breakdown of cumulative totals of residential and commercial burglaries. Please note that these figures do not include Criminal Trespass.
Typically, residential burglaries outnumber commercial burglaries; however, greater losses on average are reported in commercial burglaries. Both kinds of burglary increased overall in 2017.
While the overall number of burglaries and attempted burglaries offences in 2017 increased by 19% over 2016 (596 vs. 501), a review of the incidence of these offences for the past five years shows that these numbers are nonetheless fewer on average. Graph 2 (below) describes the incidence of burglary and attempted burglary since 2013. On average, 672 burglaries and attempted burglaries occur each year (with averages of 598 and 74, respectively).
Graph 2. Incidence of Burglaries and Attempted Burglaries, 2013-2017
It is the position of the RCIPS that even the lowest burglary figure in this table (439 burglaries in 2016) is still too high an annual incidence of burglary for a population of 60,000. The persistence of the burglary problem in the Cayman Islands, as shown in Graph 2, indicates the complexity of it.
Burglary prevention is a central objective of the RCIPS’ new community policing program and public education efforts. Burglary detection also forms a major objective within the detective portfolio, with detectives re-deployed to the districts at several junctures in 2017 to investigate crimes and arrest offenders. As a result of these efforts, sixty-three burglary charges were laid in 2017. Currently, fifteen people are serving prison sentences for burglary while another six are on remand.
The RCIPS is currently in the process of establishing a dedicated Joint Crime Task Force (police and immigration), headed by a Chief Inspector, which will be responsible for serious crime investigations, specifically into burglary, robbery, firearms, drugs and gambling offences. This is a strategic priority of the National Security Council, and we believe that a properly staffed and resourced task force of this kind can maximize the impact that enforcement can have on crime and related offences.
From the perspective of crime prevention, 2017 and 2018 has seen renewed interest in neighbourhood watch programs across the islands, facilitated by new beat officers who are developing relationships with residents in their new areas. It is also a priority of the Community Policing Department in 2018 to establish new watches in all districts, while the Media and Communications Unit will be working with partners and the media to promulgate crime prevention tips and messages in a sustained campaign.
These efforts can only form part of the answer, however, to a problem rooted in drug abuse, recidivism and social issues that are outside the scope of policing alone, and require a multi-pronged and multi-agency approach to address meaningfully.
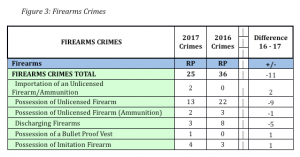
7. Firearms Crimes and Firearm Recoveries
The figure for Firearms Crimes from Figure 1 is broken down in Figure 3 into six different categories.6
In 2017, there were 25 confirmed firearm crimes, which was a decrease of 31% (11) compared to 2016. Firearm crimes in 2017 accounted for only 0.6% of all crimes recorded.
Injuries from firearms also fell, though slightly, over the reporting period. There was 1 murder in 2017 with the use of a firearm, in comparison to 2016 when 2 murders occurred with the use of a firearm. In 2017, five people were shot and injured compared to 2016, when 3 people were shot and injured.
This decrease in firearm crimes occurred alongside a stark increase in the number of firearms recovered by police. In 2017 twenty-nine firearms were recovered, an increase of 61% over 2016, when 18 were recovered.
Of the 29 firearms recovered in 2017, 19 were manufactured firearms and 10 were imitation or modified flare guns or air pistols. In 2016 there were 18 firearms recovered, of which 14 were manufactured firearms and 4 were imitation or modified flare guns or air pistols.
Figures from the last two years suggest that the removal of illegal firearms and a decrease in firearms crimes are strongly correlated. The high number of firearm recoveries in 2017 may have prevented some serious crimes, and is a credit to the officers who accepted a level of risk to take them off the street.
During 2018, in an effort to remove the maximum number of illegal firearms from our communities, the RCIPS will be conducting a firearms amnesty together with partners from the business and religious communities, as well as non-profit organizations.
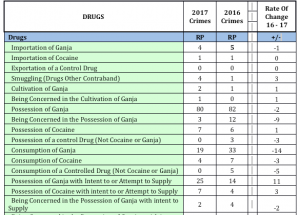
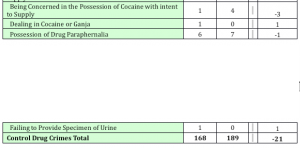
8. Drug Offences
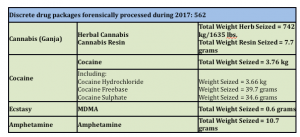
Drug Offences are broken down into several categories, as shown in Figure 4. The largest drug seizures were of Cannabis (Ganja), followed by Cocaine (See Figure 5).
The majority of drug offences resulted in arrests, and generally stemmed from proactive policing and police operations. In 2017, 168 drug crimes were recorded, of which 112 have been detected to date. In 2016, 189 were recorded and 163 have been detected to date. In sum, the average detection rate for drug offences is nearly 80% for the past two years.
Overall, there was an 11% (21) decrease in drug crimes in comparison with 2016. It is important to note that decreases in discrete drug offences can happen even while the overall amount of drug seizures and drug enforcement increases. Interdictions of drug shipments remove large quantities of drugs from circulation, which then results in fewer individuals being in possession of, and likewise being arrested for, drug crimes.
Drug offences account for 4% of all crimes recorded in the Cayman Islands in 2017.
Figure 5 is compiled based upon requests for forensic examinations of recovered drugs. In 2017, 562 requests were made for such forensic examinations. The drugs that were processed are broken down into the different categories below, showing the total weight in each category. The total amount of ganja seized in 2017 was 1,635 lbs., which was slightly higher than the amount seized in 2016 of 1,489 lbs.
9. Domestic Violence and Child Safeguarding Referrals
Presenting accurate statistics regarding crimes that occur within the home or involve children victims typically presents a challenge, since such violence or abuse does not typically fall neatly within the parameters of specific offences, but may span across different offences, depending on the circumstances. It is instructive in this regard to recall the definition of domestic violence as “the physical, sexual, emotional or financial abuse of one person by another who is in or has been in a personal relationship with them. The relationship may be between partners or ex-partners or other family members.”7 Therefore, it is not possible to look to one offence, e.g., Threats to Kill, as an indicator of domestic violence, when not all such threats are domestic in nature, and domestic violence in many situations may not include threats at all. Therefore, a statistical indicator specific to domestic violence or child abuse must be used to obtain figures that illustrate the amount of this type of violence or abuse being reported.
Within the RCIPS, this indicator takes the form of a referral from police officers or civilian intake staff to the Family Support Unit or Multi-Agency Safeguarding Hub (MASH). If a 9-1-1 call for service or report is taken which indicates that individuals are at-risk for domestic violence, or that children may be in need of protection, a referral is generated to the Family Support Unit/MASH for its information, guidance, and investigation if necessary. These referrals are split into two categories, Domestic Violence and Child protection referrals. Most often these referrals result from reports of physical violence, verbal arguments and other incidents which indicate that a vulnerable person is at risk.
Graph 3: Domestic Violence and Child Safeguarding Referrals, 2015-2017
Red indicates domestic violence referrals, while purple indicates juvenile safeguarding referrals.
Graph 3 indicates a sharp increase in the number of referrals sent to the Family Support Unit in both categories during 2017, but moreover, a steady increase in domestic and child protection referrals over the last three years.
In 2017, 990 domestic violence referrals were received and processed, which was an increase of 33% over 2016. Likewise, 491 child safeguarding referrals were received and processed, which was an even more dramatic increase of 80% over 2016.
The establishment of the MASH in new offices at Anderson Square in March 2017 may account for some of the increase in domestic and safeguarding referrals, as this launch was covered broadly in the local media. The subsequent success of Child Safeguarding Investigation Unit (CSIU) detectives in court on several high profile matters may also have persuaded some victims of violence and abuse, especially historic abuse, to come forward and make a report. Detectives are confident that the increase in safeguarding referrals in 2017 does not represent a spike in the incidence of such crimes over this past year, but instead a difference in the reporting behavior of victims. It is also important to note that some of the referral numbers may be linked to incidents that did not take place in the reporting year.
Since the inception of the MASH, detectives and DCFS social workers have been working hard to build this trust with the community and raise awareness; they have made appearances in local media and participated in awareness-raising events with agency and nonprofit partners. It is anticipated that the number of referrals may grow as the reputation of the MASH builds in the community.
10. Cyber Crimes and Incidents
The RCIPS Cyber Unit has been monitoring cyber crime incidents in the Cayman Islands since 2010. While the Unit is limited in its ability to investigate cyber-dependent and cyber-enabled crime at this time, its capacity is increasing, with the goal of incorporating digital forensics, cyber incident response and cyber crime analysis and investigation services to support all law enforcement agencies and CI Government departments in combatting both “traditional” crime and cyber crime.
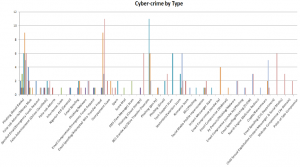
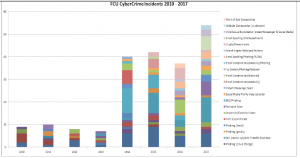
In 2010, cyber-crime incidents were extremely rare to non-existent. Cyber crime reports started to spike in 2014, and have continued to rise since that time. Cyber crime incidents are not included in the overall crime figures due to their variance and complexity. However, the below graphs (Figures 6 & 7) and information are being included in this document in order to begin to illustrate this area of criminal activity for the benefit of public awareness.
Business Email Compromise (BEC) was the primary cause for the rise in cyber-crime from 2014 to 2016, along with phishing emails using the brands of local retail banks and being sent to customers and general public. The criminal objective behind these activities was to compromise online banking accounts.
Business Email Spoofing (BES) saw an increase in 2015 and has been the primary cyber crime incident reported in 2017. There were 11 BES incidents reported in 2017. There has been an increase in spoofed emails that attempted to mimic the email accounts of both the RCIPS and Immigration Department.
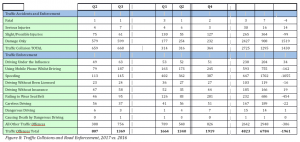
11. Traffic Collisions and Enforcement
Traffic statistics for 2017 present a mixed picture in terms of general road safety in the Cayman Islands. The number of fatal accidents on the islands continues to fall for the second straight year, with only three (3) fatal accidents occurring in 2017, causing six (6) road deaths in total. In 2016 seven (7) fatal accidents caused seven (7) road deaths.8 These statistics indicate a welcome downward trend from 2015, when thirteen people lost their lives on the road. At the same time, accidents causing serious injury have nearly doubled.
The total number of traffic collisions throughout the islands registered a startling increase, from 1295 to 2725. Eighty-nine percent of these were categorized as “damage only” road collisions. Traffic officers attribute this increase to a number of factors, including more precise internal police reporting procedures around low-level accidents.
They also report that they have observed a change in behavior around the reporting of low-level accidents. Changes to the Traffic Law in 20119 enabled motorists involved in “damage only” collisions to resolve their incidents without police involvement if both parties could come to an agreement. Some motorists elected to resolve matters amongst themselves after changes to the law came into effect; however, over time it appears that motorists have moved away from on-site agreements, having found that one or both parties have not reliably kept to these agreements. Traffic officers advise that more and more motorists are filing late accident reports when such agreements have fallen through.
We believe that these factors may account for some of the increase in traffic accidents. Traffic officers also believe that the overall number of traffic collisions is rising in real terms.
Traffic enforcement of drunk driving, and driving without insurance, increased steadily in 2017, but enforcement across other categories fell. The Traffic and Roads Policing Unit (TRPU) began the year as a small, re-launched unit capable of only strategic enforcement and serious collision investigations. Staffing increased incrementally throughout 2017, but could not sustain 2016 enforcement levels due to emergency hurricane season secondments and leave.
The TRPU began 2018 fully staffed and equipped, and has been running regular operations around the islands targeting different offences. So far this year (as of 19 April), one hundred fifty-three motorists have been arrested for driving under the influence or otherwise impaired, 672 speeding tickets have been issued, and 178 tickets have been issued for using a mobile phone while driving. These numbers clearly indicate that this year’s enforcement totals will far exceed those of recent years, and hopefully help bring about a change in behavior on the road for the benefit of general public safety in the Cayman Islands.
Cayman Islands Crime and Traffic Statistics Report 2017 – Attachments
Figure 1: Cumulative Totals of Crimes, 2017 vs. 2016 Crime Statistics for Cumulative Period
Figure 1 summarizes crime totals for the years 2017 vs. 2016.
The overall cumulative incidence of crime across general categories has varied slightly year-on year, as such: Serious Crimes (less than 1%), Other Crimes (approximately 5%), Overall (less than 1%).
See Attached Images: FIG 1 A- D
Figure 2: Burglaries by District
Figure 2 describes burglaries and burglary-related offences (burglary, attempted burglary, aggravated burglary and burglary with intent to rape) across all districts.
Typically, residential burglaries outnumber commercial burglaries; however, greater losses on average are reported in commercial burglaries. Both kinds of burglary increased overall in 2017.
See Attached Image: FIG 2
Figure 3: Firearms Crimes
In Figure 3 Firearms Crimes are broken down into the six different categories.
In 2017, there were 25 confirmed firearm crimes, which was a decrease of 31% (11) compared to 2016. Firearm crimes in 2017 accounted for only 0.6% of all crimes recorded.
This decrease in firearm crimes occurred alongside a stark increase in the number of firearms recovered by police. In 2017 twenty-nine firearms were recovered, an increase of 61% over 2016, when 18 were recovered.
See Attached Image: FIG 3
Figure 4: Drug Offences in 2017
Drug Offences are broken down into several categories, as shown in Figure 4. The largest drug seizures were of Cannabis (Ganja), followed by Cocaine (See Figure 5).
Overall, there was an 11% (21) decrease in drug crimes in comparison with 2016. However, possession of ganja with intent to supply increased by 79% (11). Drug offences account for 4% of all crimes recorded in the Cayman Islands in 2017.
See Attached Images: FIG 4 A & B
Figure 5: RCIPS Drug Seizures in 2017
Figure 5 is compiled based upon requests for forensic examinations of recovered drugs. In 2017, 562 requests were made for such forensic examinations. The drugs that were processed are broken down into the different categories shown, showing the total weight in each category.
See Attached Image; FIG 5
Figure 6: Cyber Crime by Type, 2010-2017
NOT AVAILABLE
Figure 7: Annual Cyber Crime Incidents, 2010-2017
Cyber crime incidents are not included in the overall crime figures due to their variance and complexity. However, Figures 6 & 7 are being included in this document in order to begin to illustrate this area of criminal activity for the benefit of public awareness. In 2010, cyber-crime incidents were extremely rare to non-existent. Cyber crime reports started to spike in 2014, and have continued to rise since that time.
See Attached Image; FIG 7 A & B
Figure 8: Traffic Collisions and Road Enforcement, 2017 vs. 2016
The number of fatal accidents on the islands fell for the second straight year, with only three (3) fatal accidents occurring in 2017, causing six (6) road deaths in total. In 2016 seven (7) fatal accidents caused seven (7) road deaths. At the same time, accidents causing serious injury have nearly doubled. The total number of traffic collisions throughout the islands registered a large increase, from 1295 to 2725. Eighty-nine percent of these were categorized as “damage only” road collisions.
See Attached Image; FIG 8 A & B